Backtesting: Unveiling the Power of Historical Data in Investment Strategies
Introduction:
Investments in financial markets are highly unpredictable, and nothing can provide complete certainty. But still, all types of investors (be it value, growth, or momentum) create investment strategies. Some of them are able to generate good returns and others fail. Even though you can’t be 100% sure about your strategies, there are ways you can increase the probability of succeeding in the markets. And one of the ways is the backtesting tool available on sharpely. Generally, this type of advanced tool is available only to institutional investors, but we have made it available to retail investors.
What is backtesting?
Investors develop various kinds of strategies, but it is difficult to bet on them without any tests. Backtesting refers to the process of evaluating the effectiveness and accuracy of a trading/investment strategy using historical data. The main objective of backtesting is to assess how well a particular strategy would have performed if it were applied to historical market data.
Why Backtesting?
Backtesting is a game-changer for investors. It involves testing investment strategies using historical market data to assess their past performance. By simulating trades based on historical conditions, investors can analyze the strategy's track record and its ability to handle various market scenarios. This analysis leads to refined and optimized investment approaches, ultimately resulting in more confident and informed investment decisions.
This ultimately helps investors in increasing their odds of success.
Backtesting using sharpely
At sharpely, we encourage investors to carry out thorough investment research. And we offer many tools and features for the same. One such feature is backtesting on sharpely. There are a number of backtests that you can run on sharpely.
- Evaluate the effectiveness of your stock screen using the screen backtest
- Backtest your Factor Models
- Backtest an individual stock metric (e.g. P/E) to see how effective that metric is in picking/screening stocks.
- Backtest custom baskets of stocks, ETFs, or Mutual Funds
Before jumping into how you can use this feature, let’s look at the process of backtesting in an easy-to-understand manner.
Here's what the back-testing process looks like:
Data Collection
Gathering accurate historical market data, such as stock prices, bonds, and commodities, is the first step in backtesting. sharpely has partnered with some of the best data providers, like Factset and Value Research, for high-quality data.
Avoid biases
The backtesting process should avoid biases like survivorship bias and look-ahead bias. We take special care to avoid these biases and you can read more about it here.
Strategy Formulation
Investors define their investment strategy, incorporating fundamental analysis, risk management principles, and other criteria to guide buy and sell decisions. You can use our screeners and Factor models for strategy creation.
Simulation
Sharpely, being the top data-driven investment research platform, simulates trades based on the predetermined strategy, tracking hypothetical positions, entry and exit points, profits, and losses. On sharpely, you will get these results in a matter of seconds.
Performance Evaluation
As an Investor, you should evaluate your strategy's performance during the simulation, analyzing key metrics like risk-adjusted returns and maximum drawdowns. sharpely gives you a detailed report of your strategy’s performance.
Analysis and Optimization
Armed with backtesting insights, you can refine and optimize your investment approach for improved future performance.
Now let’s look at how you can use sharpely’s screener and Factor Models to create your investment strategies and backtest them.
Backtesting of Screener based Investment Strategy
The steps involved are as follows:
Step 1: You create a stock screen by defining your rules and get a filtered list of stocks.
Step 2: At this step, you would like to evaluate how good your screen is. You can, with a single click, backtest the entire screen using the backtest button. The methodology followed for the screen backtest is explained in detail here.
Suppose you are satisfied with your screen. Now you decide to proceed. Note that you have not created an automated investment strategy yet. You have only defined the stock selection criteria (your screen). To create an investment strategy, you need to define a few more rules which on shareply is called building a basket.
Step 3: Not that you have the screen in place, you can proceed with building the basket. You define the stocks that you want to part of your portfolio (e.g., pick top 20 stocks by market cap from the list of 40 stocks screened). Then you define weights that you want to ascribe to each stock and finally, you define when to rebalance the portfolio.
Step 4: Now that your basket is ready, you can see the back-tested performance of your basket which simulates your strategy (screen + weights + rebalancing frequency) on historical data.
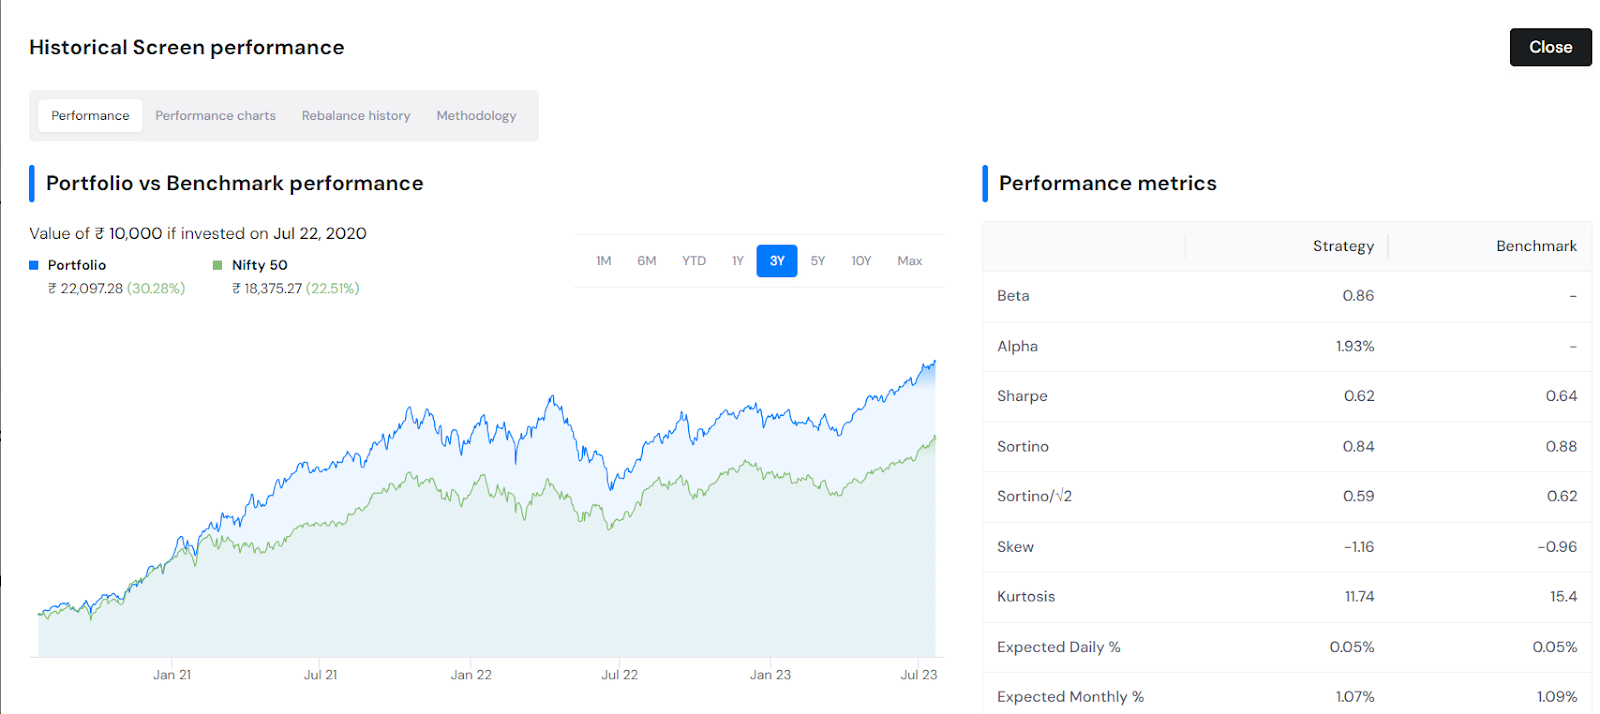
You get a detailed report of your strategy. You will be able to see the historical returns of your strategy along with the benchmark. Various risk measures like max drawdown and Sharpe ratio, monthly returns of your portfolio with entry and exits, and many more. Using this, you can make modifications to your strategy and maximize your returns in the market!
Backtesting of Factor Model based Investment Strategy
The Factor Model is yet another way to filter out stocks on sharpely. Using Factor Models, you can choose the metric of your choice and assign weight according to the importance of each metric. This helps us in eliminating the problem of edge cases. Too technical to understand? Then do give this blog series a read where we have explained everything about Factor Models.
The steps involved in building and backtesting a Factor Model based strategy are similar to a screener-based strategy.
The only difference is that in this case, the Factor Score becomes your stock selection criteria instead of a screen.
Benefits of Backtesting
Strategy Analysis:
Backtesting allows you to evaluate the performance of your strategy using historical data. It helps you analyze your strategy in different time periods and market conditions.
Modifications and updates:
You can modify your strategy by analyzing the outcomes of the backtest. If the strategy is not performing well, you can always change the approach and update the parameters.
Reassurance:
If the strategy has been working flawlessly, it gives you the conviction to invest your own money and stick to the strategy when the markets are not in your favour. This way, backtesting can help you create a robust investment framework.
Limitations/drawbacks of Backtesting
Data Quality:
Backtesting relies on data, and the data quality cannot be compromised while backtesting. Data differences of even a few percent can affect the results of a backtest.
But backtesting on sharpely is super reliable as we use data from FactSet and Value Research. FactSet is the leading data provider for company fundamentals (globally), and the same goes for Value Research (for data related to mutual funds and ETFs).
Historical Bias:
Backtesting relies on historical data, but market conditions can change drastically. The strategy can fail in severe events like a black swan event or an economic crisis. The regulatory issue also persists.
Controlled Experiment
Backtesting can be conducted using only historical market movements and the available data based on those movements. We can’t simulate various market conditions in the backtesting. And this can lead to overfitting of the strategy.
Overfitting
Based on historical data, investors tweak their strategy. This can lead to overfitting, which occurs when the strategy is tailored to fit the historical data but fails to perform in real-world conditions.
Conclusion
Backtesting is one of the most useful tools for investors, as it helps you test your strategies and refine them by analysing the outcome. This technique is widely used in the investment industry but it is mainly available to institutional investors. We, at sharpely have tried to democratize the same for retail investors. The core of backtesting lies in historical data. The outcome of the backtest depends heavily on the quality of the data. However, don’t use this tool as a crystal ball as there can be times when backtested strategies fail in real-world conditions due to certain events.