
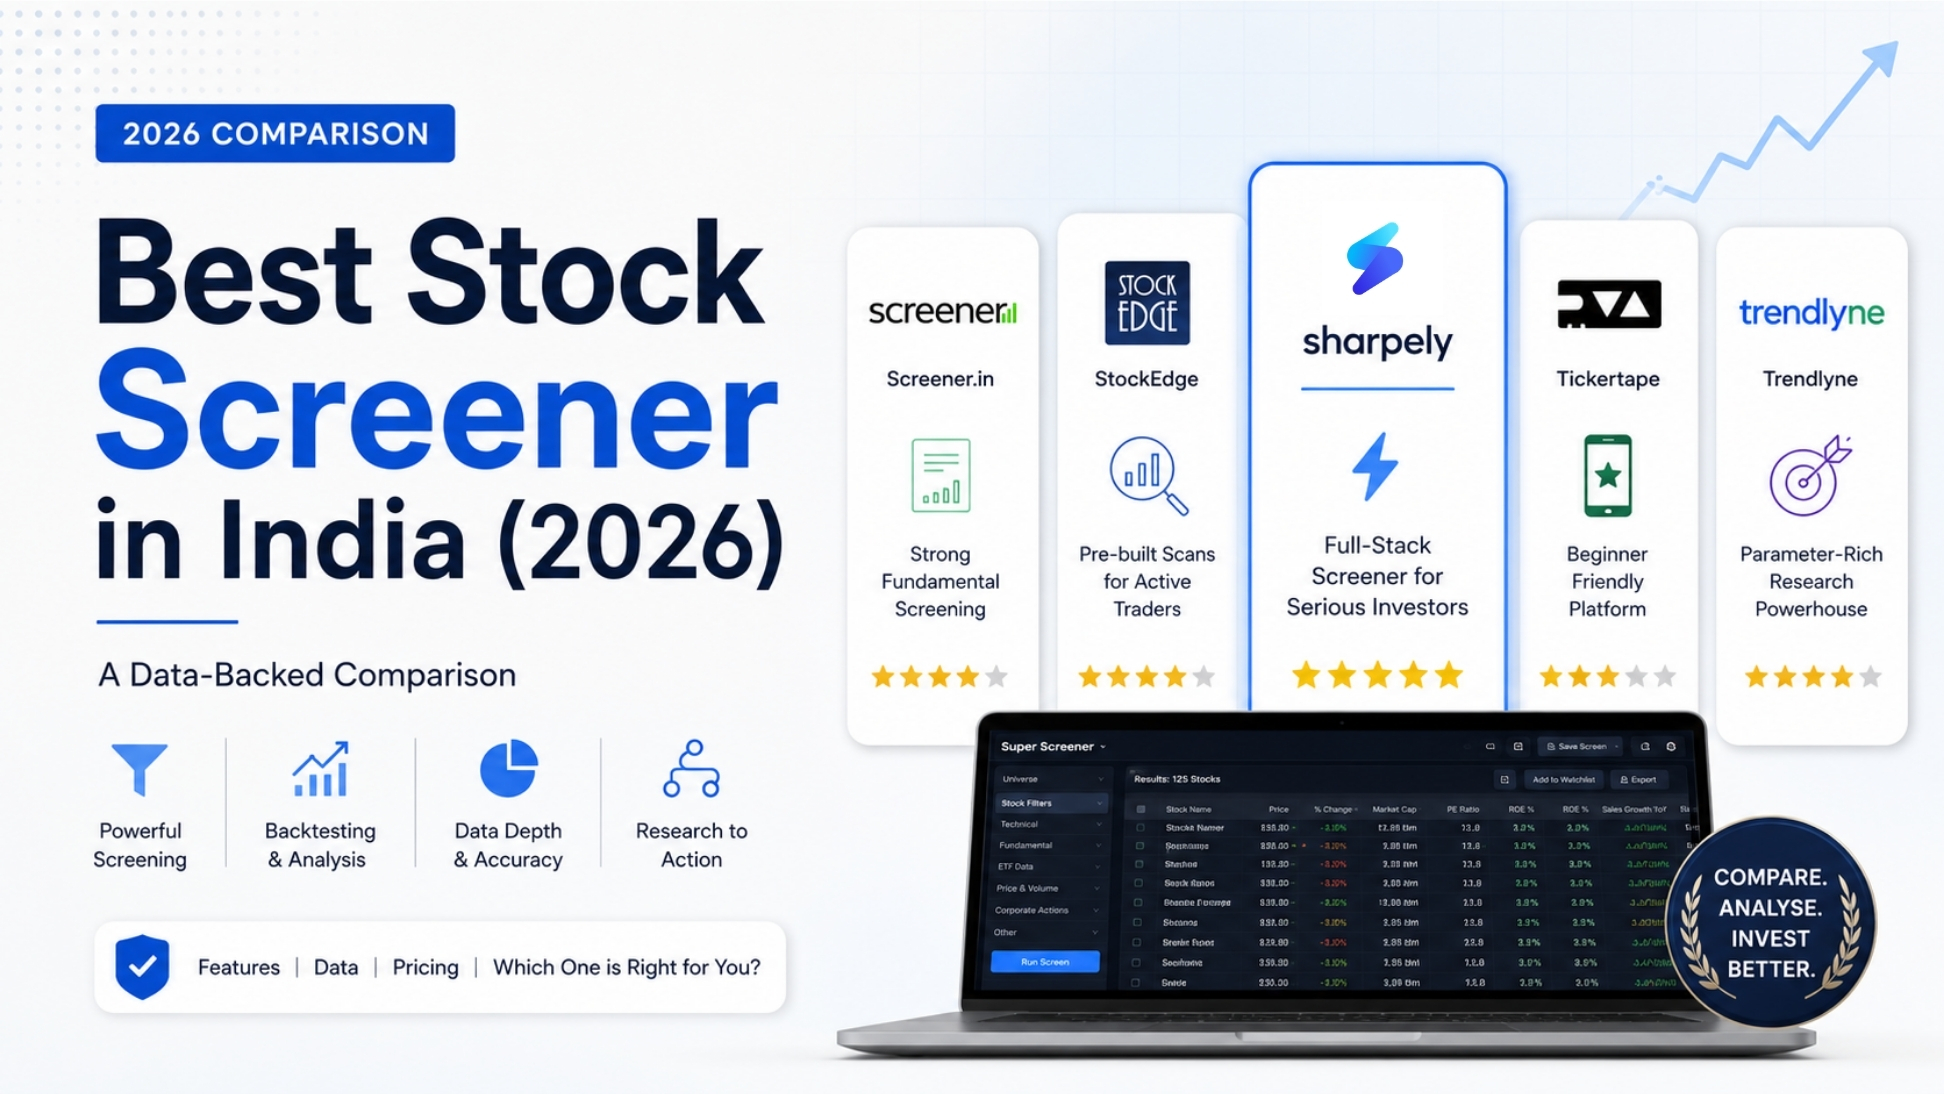
Choosing a stock screener in India is not a simple decision. Five platforms dominate the active investor’s toolkit: Screener.in, StockEdge, Tickertape, Trendlyne, and sharpely, and each has genuine strengths, genuine gaps, and a different investor in mind when they built it.
Most platform comparisons are written by one platform about itself. They list every feature the home platform has and mark everything else absent. That is not useful, and experienced investors can see through it.
This comparison takes a different approach. Each platform’s genuine strengths are acknowledged. The feature data is sourced from publicly available documentation. And the conclusion is direct about who each platform actually serves, rather than claiming a universal winner that does not exist.
What Separates a Good Screener from a Great One
Most investors think of a stock screener as a filter: you set some conditions and get a list of stocks. That is where most platforms stop. But a genuinely powerful screener does far more:
It combines technical and fundamental conditions in the same screen. A screen that only works on fundamentals or only on technicals is half a tool. The most useful screens combine both, for example, finding companies with strong earnings growth that are also breaking out of a technical base.
It lets you verify the screen against history. What would this screen have shown six months ago? A year ago? The ability to replay a screen on any historical date is the difference between testing whether your logic is sound and hoping it is.
It tells you whether the screen actually works. Backtesting! Running your screen against historical data to see how a portfolio of screen results would have performed is the most rigorous quality check a screen can undergo. Without it, you have no evidence that your filtering logic produces anything other than a list of stocks.
It connects seamlessly to what you do next. A screener that shows results but then requires you to open five other tools to chart, research, and act on those results is a friction-heavy workflow. The best screeners connect directly to charts, stock research, and portfolio actions.
With those criteria in mind, here is how each platform performs.
The Five Platforms: Strengths and Gaps
Screener.in: The Fundamentals Benchmark
Screener.in is India’s original fundamental stock screener and still the reference point for value investors who want to write custom queries against financial data. Its community has built tens of thousands of screens across every investing style. The query language is super simple and powerful, and the financial data depth- 10+ years of P&L, balance sheet, and cash flow- is exceptional for pure fundamental research.
What Screener.in does not do: technical screening, backtesting, mutual fund research, or strategy building. It is a pure fundamental data and screening tool, the best of that specific type in India, but limited to that type.
StockEdge: Pre-Built Scans for Active Traders
StockEdge is designed for active traders who want daily pre-built scan results combining technical patterns, fundamental criteria, and market activity, without needing to build a screener from scratch. Its scan library is large, and the community and education content are genuine differentiators. Custom screener building is more limited compared to platforms built for query-driven investors.
Tickertape: The Beginner-Friendly Platform
Tickertape is the most consumer-friendly platform of the five. Clean mobile experience, beginner-oriented stock discovery, smallcase integration, and a straightforward portfolio tracker make it the best starting point for investors in their first two years. The screener has 200+ filters but limited advanced logic support. As an investor’s sophistication grows, Tickertape’s tools become increasingly insufficient.
Trendlyne: The Parameter-Heavy Option
Trendlyne has the largest raw parameter library at 1,000+ screening parameters, real-time data during market hours, a proprietary DVM scoring system, and a capable but inaccurate backtesting module. It is the most feature-dense of the five and caters to research-oriented investors who want maximum filtering breadth. The UI has a steep learning curve and mutual fund tools are limited, but for parameter depth in stock screening, Trendlyne leads this comparison!
sharpely: The Full-Stack Screener
sharpely’s Super Screener is the most architecturally complete screener in this comparison, not because of a single feature, but because of how many distinct layers of capability are integrated into one tool. The architecture deserves a dedicated section.
Inside sharpely’s Super Screener: What It Actually Does
Most screeners are built around one idea: filter stocks by conditions and show a list. sharpely’s Super Screener is built around a different idea: the screener is the beginning of an integrated research and strategy workflow, not the end of one.
Technical + Fundamental in the Same Screen
sharpely lets you combine technical and fundamental conditions in a single screen, with no artificial separation between the two. You can screen for companies with a debt-to-equity below 0.5 and a close price above the 200-day moving average and profit growth above 20% YoY and RSI between 40 and 60, all in one screen, with all conditions evaluated simultaneously.
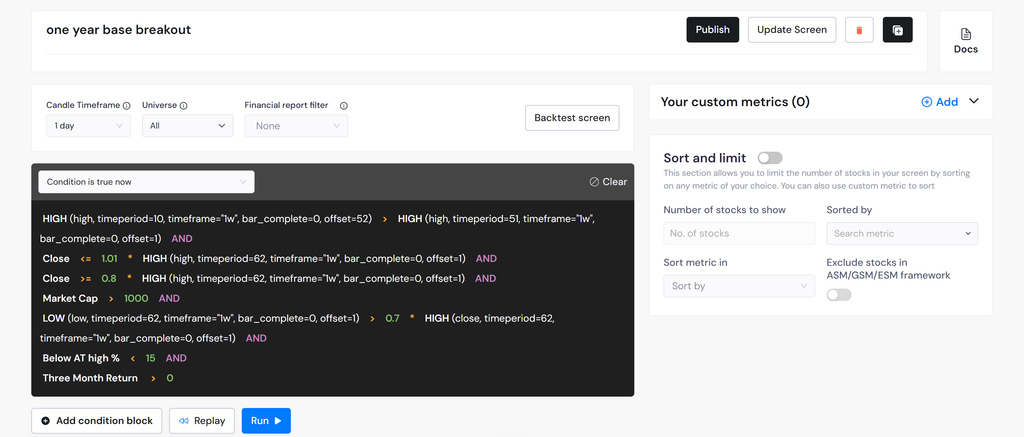
The technical screening capability is built with custom function support, making it comparable to or ahead of dedicated technical screeners like Chartink in terms of what conditions you can construct. Functions allow you to define relationships between indicators rather than just setting absolute thresholds. For example: ‘Volume is higher than the EMA of volume of last 15 days‘ is a function-based condition that most screeners cannot express. Check the complicated screening conditions to find stocks having a one-year breakout.
Multiple Condition Blocks
Screens on sharpely are built using multiple condition blocks, separate groups of conditions that can be combined using AND/OR logic. This means you can construct screens with sophisticated logical structures: ‘stocks that meet this set of technical conditions AND this set of fundamental conditions, OR this alternative set.’ The block architecture makes complex screens readable, maintainable, and significantly more powerful than single-list condition builders on other platforms.
Custom Metrics
Beyond the 500+ built-in parameters, sharpely allows you to create your own custom metrics, defined formulas built from existing data points that become new screening parameters. If the specific ratio or composite metric you want does not exist in the default library, you can build it. This is a capability that previously existed only in professional quant tools and is unavailable on any other platform in this comparison.
The Financial Report Filter
sharpely has a dedicated Financial Report Filter that restricts screening conditions to the most recently reported quarterly results, as opposed to trailing twelve months or annual data. This is the feature that makes sharpely’s screener specifically designed for results season. When you run a screen during earnings season, conditions like ‘Sales growth YoY > 20%’ evaluate against the latest filed quarter, not a historical average. No other platform in this comparison offers this specific results-season screening mode.
Replay on Any Historical Date
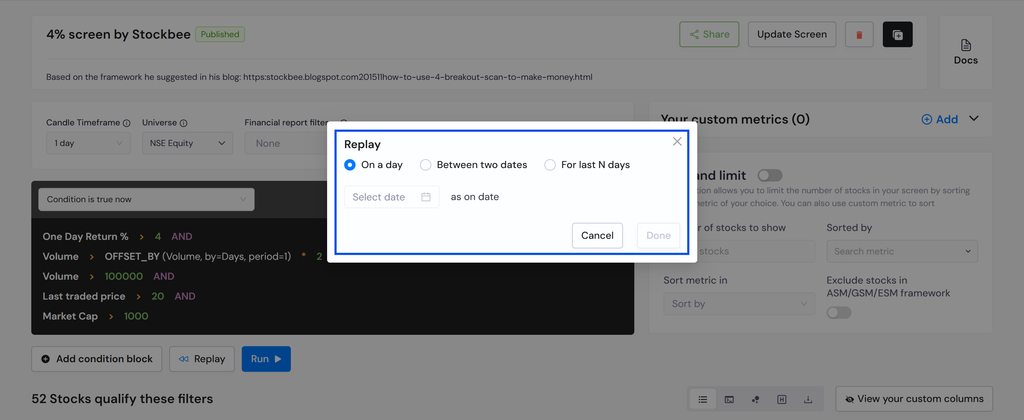
This is one of the most practically useful and underappreciated features in the screener. sharpely’s Replay function lets you run any screen against historical data, asking, ‘what stocks would this screen have returned if I had run it 10 days ago? 30 days ago? Six months ago?’ This is not backtesting; it is historical validation. It lets you verify that your screen logic was producing sensible outputs across different market conditions before you trust its current results.
Screener Backtesting
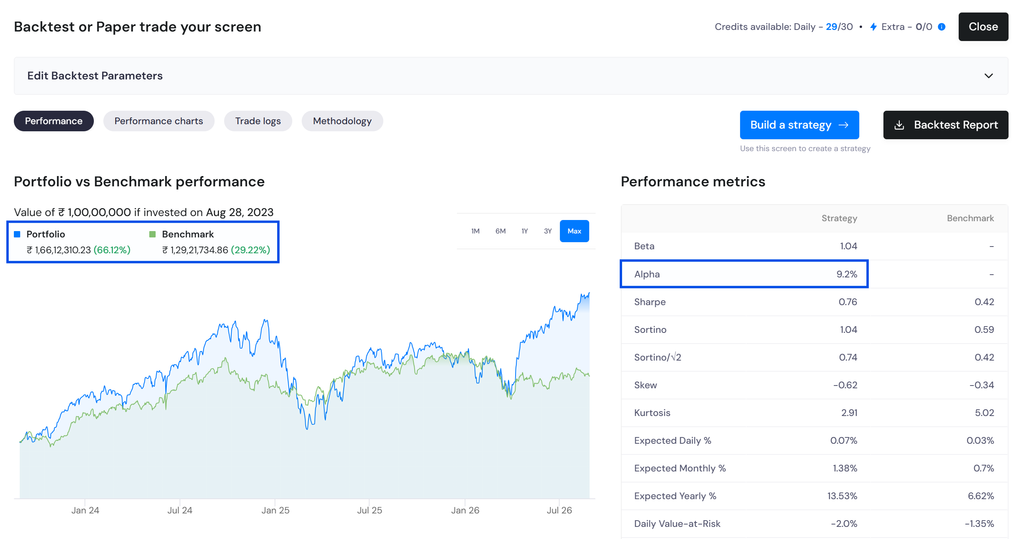
Once you have a screen you believe in, sharpely lets you backtest it, simulating a portfolio where you buy stocks that pass the screen and sell stocks that no longer pass it, running that simulation across historical data, and seeing what returns, drawdown, and Sharpe Ratio that strategy would have produced. This converts a screen from a list of stocks into an evidence-based investment thesis. A screen with a 15% backtested CAGR and a clear thesis is a fundamentally different proposition from a screen with no historical evidence behind it.
Charts in the Screener Page and in the Terminal
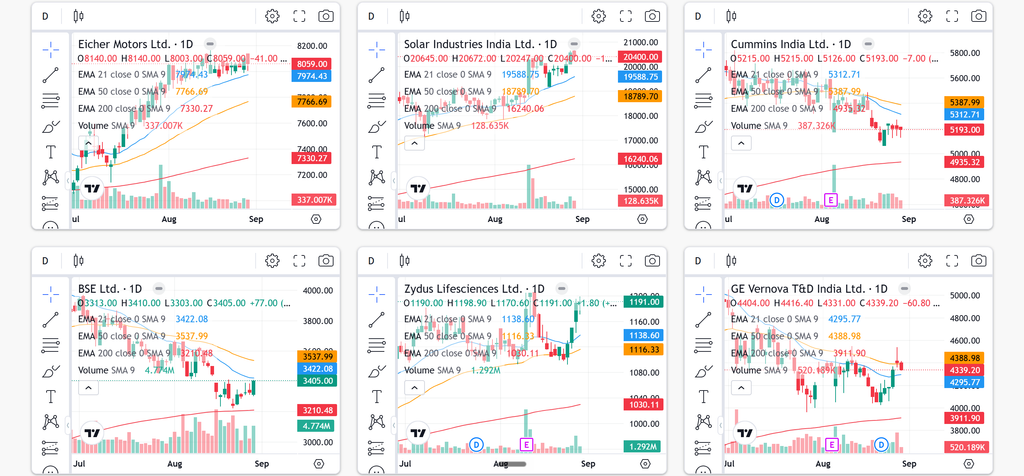
After running a screen, sharpely displays the filtered stocks with inline chart access directly on the screener results page. You do not need to open a new tab or navigate to a different section to check the chart of a stock that cleared your filters. The charts are also available in the sharpely Terminal, a customisable, multi-widget dashboard where you can view screener results alongside charts, fundamentals, sector data, and news in a single workspace.
100+ Published Community Screens
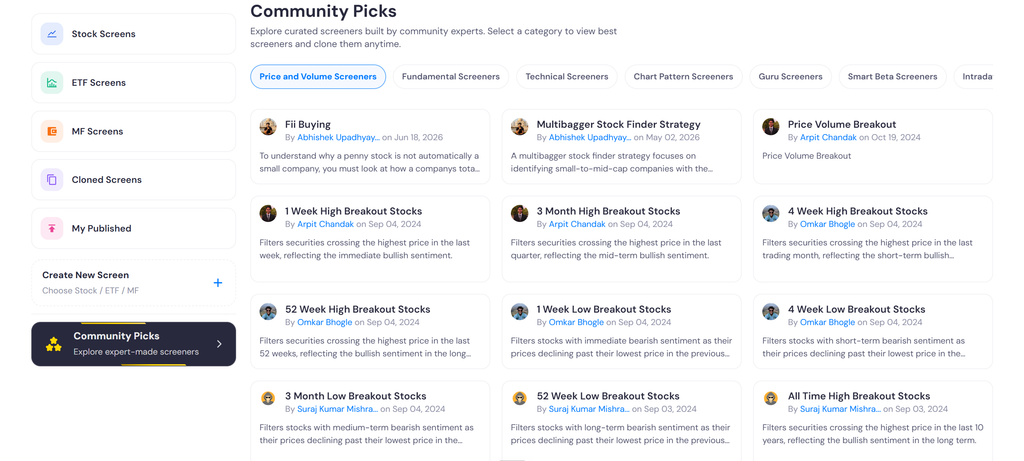
sharpely has over 100 published screens created by users and made available to the community, covering a wide range of strategies from momentum breakouts and results season quality filters to sector-specific screens and value investing checklists. New users can immediately access and run proven, community-tested screens rather than starting from scratch, while experienced users can publish their own screens and build on others’ work.
From Screener to Fully Automated Strategy
The screener integrates directly with sharpely’s Strategy Builder. A screen’s output- the stocks that pass your conditions can be used as the entry condition for a fully automated investment strategy. From there, you add exit conditions (when should a stock be sold?), stop-loss rules, position sizing, risk management parameters, and rebalancing frequency. The result is a complete rule-based investment system where the screener is not a standalone tool but the first step in a defined, automated, and backtestable workflow.
This end-to-end integration, from condition building to historical replay to backtesting to live strategy automation, is what no other platform in this comparison offers as a unified workflow.
Full Feature Comparison — 2026
The table below compares all five platforms across their key feature areas. ✅ = Available, ⚠ = Partial/Limited, ✗ = Not available. Data sourced from each platform’s public documentation as of August 2026.
| Feature | sharpely | Screener.in | Tickertape | StockEdge | Trendlyne |
| Screener Capabilities | ✅ | ✅ | ✅ | ✅ | ✅ |
| Custom stock screener | ✅ | ✅ | ✅ | ✅ | ✅ |
| Technical + fundamental in same screen | ✅ | ✗ | ⚠ | ⚠ | ✅ |
| Number of built-in parameters | 500+ | ~200 | 200+ | 500+ scans | 1,000+ |
| Custom functions in conditions | ✅ | ✅ | ✗ | ✗ | ⚠ |
| Custom user-defined metrics | ✅ | ✗ | ✗ | ✗ | ✗ |
| Multiple condition blocks (AND/OR logic) | ✅ | ⚠ | ✗ | ✗ | ⚠ |
| Financial report filter (latest quarter) | ✅ | ✗ | ✗ | ✗ | ✗ |
| Replay screen on historical date | ✅ | ✗ | ✗ | ✗ | ✗ |
| Screener backtesting | ✅ | ✗ | ✗ | ✗ | ⚠ |
| Pre-built / community screens | ✅ (100+) | ✅ | ✅ | ✅ | ✅ |
| Charts on screener results page | ✅ | ✗ | ✗ | ✗ | ⚠ |
| STRATEGY & AUTOMATION | ✅ | ✗ | ✗ | ✗ | ⚠ |
| Screener as strategy entry condition | ✅ | ✗ | ✗ | ✗ | ✗ |
| Automated strategy builder (entry + exit) | ✅ | ✗ | ✗ | ✗ | ⚠ |
| Stop-loss and risk management rules | ✅ | ✗ | ✗ | ✗ | ✗ |
| Rebalancing frequency setting | ✅ | ✗ | ✗ | ✗ | ✗ |
| Bias-free backtesting (CAGR, Sharpe, drawdown) | ✅ | ✗ | ✗ | ✗ | ⚠ |
| Custom factor models (quant) | ✅ | ✗ | ✗ | ✗ | ✗ |
| Stock baskets with rebalancing | ✅ | ✗ | ⚠ | ✗ | ✗ |
| STOCK RESEARCH | ✅ | ✅ | ✅ | ✅ | ✅ |
| Detailed stock pages (fundamentals + technicals) | ✅ | ✅ | ✅ | ✅ | ✅ |
| 10+ years of financial history | ✅ | ✅ | ⚠ | ⚠ | ✅ |
| Analyst forecasts and price targets | ✅ | ✗ | ✅ | ✗ | ✅ |
| Seasonality analysis | ✅ | ✗ | ✗ | ✗ | ✗ |
| Superstar / ace investor portfolios | ✅ | ✗ | ✗ | ✅ | ✅ |
| Customisable terminal / dashboard | ✅ | ✗ | ⚠ | ⚠ | ⚠ |
| Sector & Market Intelligence | ✅ | ✅ | ✅ | ✅ | ✅ |
| Sector heatmap | ✅ | ✗ | ⚠ | ⚠ | ✅ |
| Relative Rotation Graph (RRG) | ✅ | ✗ | ✗ | ✗ | ✗ |
| Quarterly results tracker (index/sector/stock) | ✅ | ✗ | ✗ | ✗ | ⚠ |
| FII & DII activity tracker | ✅ | ✗ | ✅ | ✅ | ✅ |
| Mutual Fund Research | ✅ | ✗ | ✅ | ✅ | ✅ |
| MF screener | ✅ (150+ params) | ✗ | ✅ (50+) | ⚠ | ⚠ |
| Rolling returns analysis | ✅ | ✗ | ⚠ | ✗ | ⚠ |
| Portfolio overlap analysis | ✅ | ✗ | ✗ | ✗ | ✗ |
| MF alpha analysis | ✅ | ✗ | ✗ | ✗ | ✗ |
| MF strategy builder and backtesting | ✅ | ✗ | ✗ | ✗ | ✗ |
| Portfolio Analysis | ✅ | ✗ | ✗ | ✗ | ✗ |
| Portfolio tracker | ✅ | ✅ | ✅ | ✅ | ✅ |
| Family / multi-member portfolio (WealthView) | ✅ | ✗ | ✗ | ✗ | ✗ |
| Broker account sync | ✗ | ✗ | ✅ | ✅ | ✅ |
| SEBI-registered research analyst | ✅ | ✗ | ✗ | ✗ | ✅ |
| Free tier available | ✅ | ✅ | ✅ | ✅ | ✅ |
| Mobile app | ✅ | ✅ | ✅ | ✅ | ✅ |
Where Each Platform Genuinely Leads
Screener.in – Best for: Investors who write custom fundamental queries and want the deepest community-built screen library. Its 10-year financial data depth and query flexibility for statement analysis remain unmatched for pure value research.
StockEdge – Best for: Active traders who want daily pre-built scan results without building screens from scratch. The learning content and community are the strongest of the five platforms.
Tickertape – Best for: Beginner investors and mobile-first users. The cleanest onboarding experience, smallcase integration, and guided discovery make it the right starting platform for the first two years of investing.
Trendlyne – Best for: Investors who need the widest raw parameter library for stock screening. 1,000+ parameters and real-time data during market hours give the broadest filtering breadth in this comparison.
sharpely – Best for: Serious investors who want the complete screener-to-strategy workflow. Technical and fundamental screening combined. Custom metrics. Replay on historical dates. Backtesting. Community screens. Chart access in the screener page. And the ability to convert a screen directly into an automated, backtested investment strategy with entry conditions, exit conditions, stop-loss, and rebalancing – without switching platforms.
Where sharpely Is Not the Best Choice
Raw parameter count: Trendlyne’s 1,000+ parameter library is larger than sharpely’s 500+. For investors who need a very specific technical or fundamental filter outside sharpely’s current set, Trendlyne may cover it. The gap narrows as sharpely adds parameters, but it exists today.
Community fundamental queries: Screener.in’s query language and its user-built fundamental screen library, built over a decade by over a million users, is the largest collection of community screens in India. For investors who want to browse and adopt ready-made fundamental screens built by others, Screener.in’s library is unmatched.
Beginner onboarding: sharpely’s depth is an advantage for serious investors and a potential friction point for someone investing for the first time. Tickertape’s guided experience is the better starting point for beginners.
The Verdict
No single platform is the universal best choice, because different investors have different workflows. Here is the clearest possible summary:
If you write fundamental queries → Screener.in. If you want pre-built scans → StockEdge. If you are a beginner → Tickertape. If you need maximum screening parameters → Trendlyne.
If you want the screener to do more than produce a list, if you want to combine technical and fundamental conditions, build custom metrics, replay screens historically, backtest them, view charts in the results page, and then convert your screen into a fully automated strategy with exit rules and risk management- the only platform in India that does all of this is sharpely.
The Super Screener is not just a filter. It is the entry point to a complete, evidence-based investment workflow. And that is the difference worth understanding before choosing a platform.
Explore sharpely’s Super Screener for free at sharpely.in.