
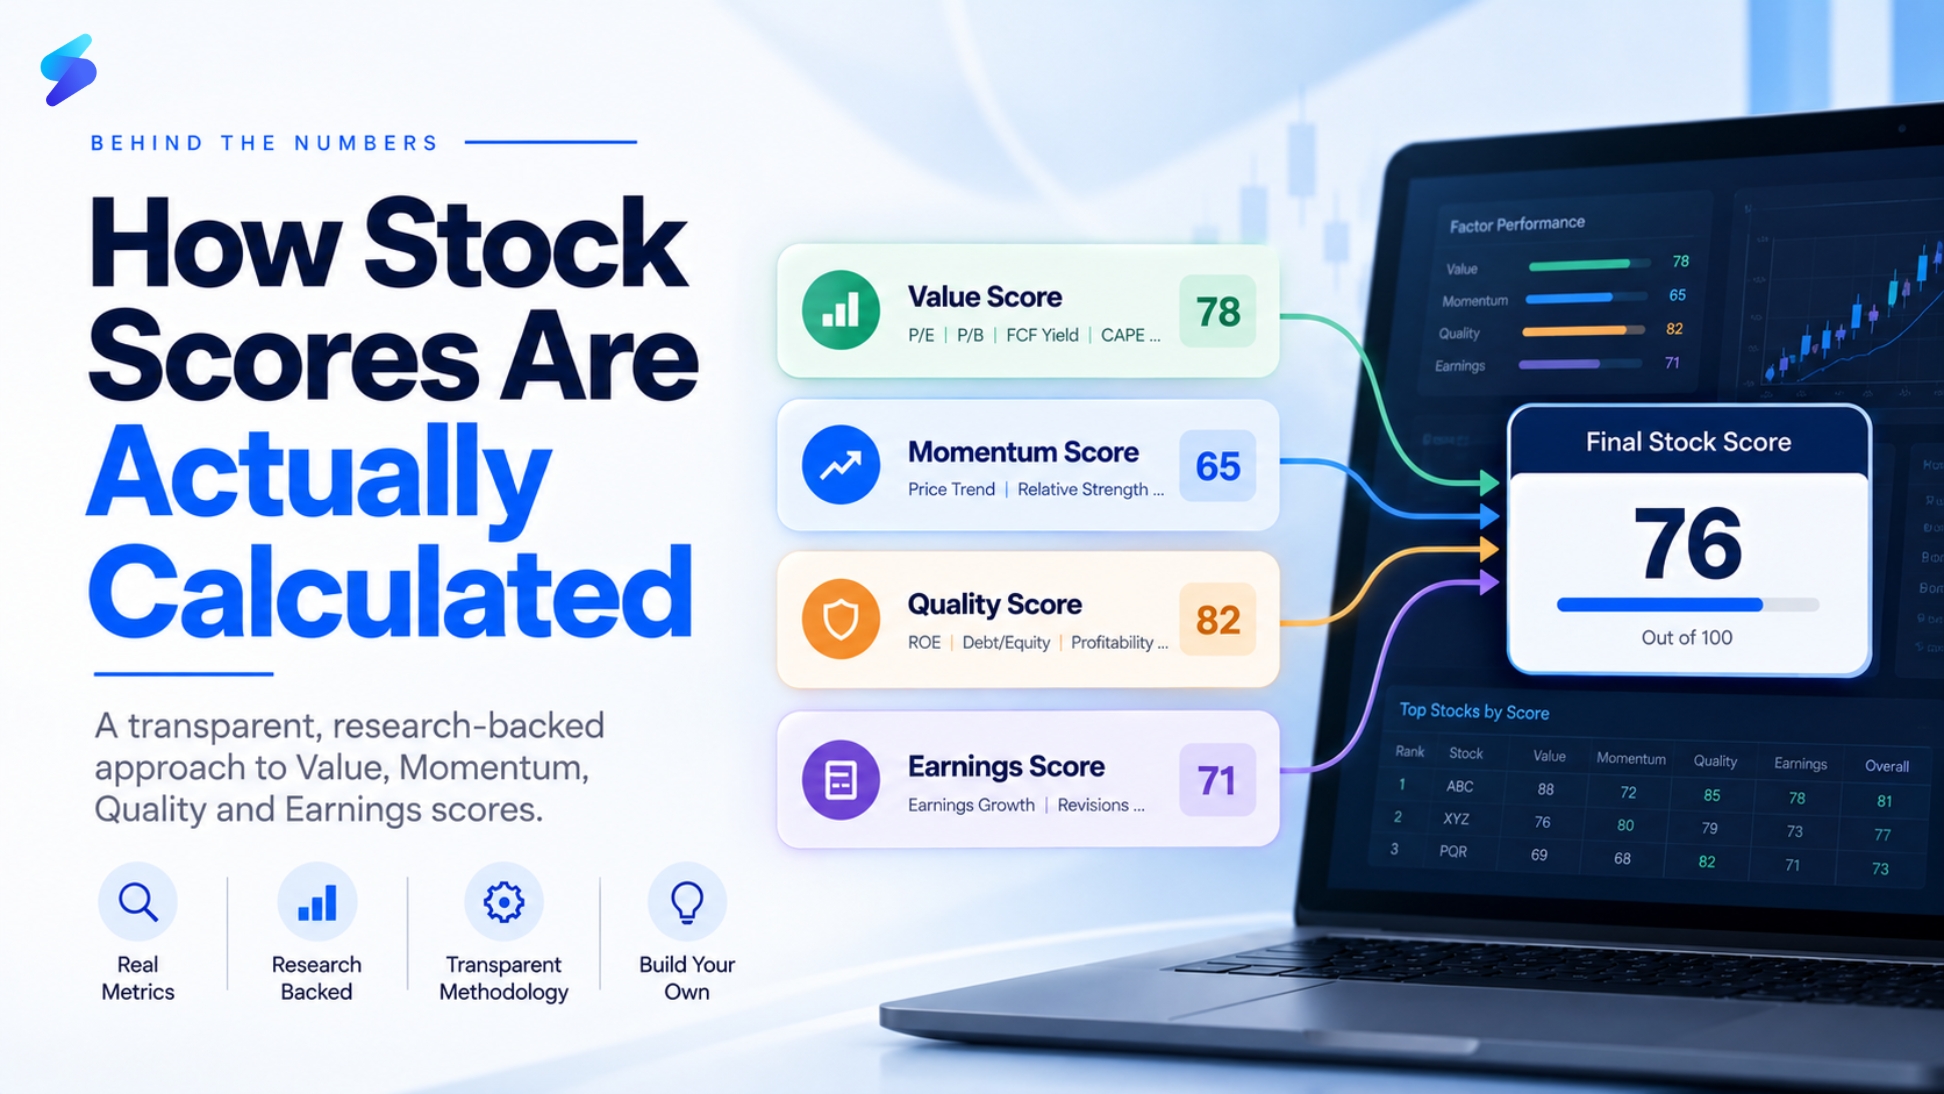
Most stock scores you encounter are a black box. A platform shows you a number between 1 and 10, and you are expected to trust it without understanding what went into it. That is a reasonable ask for a recommendation, but it is a poor basis for an investment decision.
sharpely’s factor scores are different. Every score – Value, Momentum, Quality, Earnings Momentum, Earnings Quality, and the multi-factor combinations- is built from a documented set of metrics, derived from peer-reviewed academic research, and calculated using a consistent, transparent methodology. The full documentation is publicly available.
This article explains exactly what goes into each score, why those specific metrics were chosen over alternatives, and one critical design decision sharpely made that most quant tools do not: they chose academic rigour over backtested performance on Indian data, even when that made the scores look less impressive on Indian historical data in certain periods.
The Score-Aggregate-Score Method: How Every Score Is Built
Every factor score on sharpely, whether a single-factor score or a multi-factor composite, uses the same underlying construction method: score, aggregate, rescore.
Here is how it works, using a hypothetical four-metric factor as an example:
Step 1: Score each metric independently. For each underlying metric (say, P/E ratio, P/B ratio, FCF yield, and EV/EBITDA for a value score), sharpely calculates a standardised score between 0 and 100 for every stock in the universe. A score of 100 means the stock is in the best position on that metric relative to all other stocks. A score of 0 means the worst. Crucially, a higher score is always better; the direction is normalised so investors never have to remember whether low or high is good for any given metric.
Step 2: Aggregate into a composite. The individual metric scores are combined into a single aggregate score using a weighted sum: Aggregate Score = W(A) × S(A) + W(B) × S(B) + W(C) × S(C) + W(D) × S(D). For most sharpely scores, the weights are equal; each metric contributes equally to the aggregate, reflecting the research finding that composite measures tend to be more robust than weighted combinations that overfit to specific historical periods. Do note that the exact weights of each metric are not disclosed, as that research is proprietary.
Step 3: Rescore the aggregate. The aggregate score is itself rescored between 0 and 100 relative to all stocks in the universe. This final step ensures the output is always on a consistent, comparable scale regardless of how many metrics feed into it or how widely distributed the raw aggregate values are.
This three-step process is applied identically across all single-factor and multi-factor scores, making it possible to understand, reproduce, and reason about every number on the platform.
Universe: To avoid dilution by highly illiquid or newly listed companies, all scores are calculated only for actively traded NSE stocks with a market cap above ₹100 crore. This covers the full investable universe for most retail investors while excluding names where data quality or liquidity would make the scores unreliable.
The Value Score: Five Metrics, Not One
Value investing has a long history; Benjamin Graham and David Dodd formalised it in the 1920s. The challenge is defining what cheap actually means. Individual valuation metrics are noisy: P/E ratios are distorted by one-off earnings, P/B ratios misrepresent asset-light businesses, and EV/EBITDA varies by capital intensity.
Academic research, particularly work from AQR Capital, has consistently shown that composite value measures outperform any single valuation metric. The intuition is straightforward: multiple independent noisy signals, combined, reduce the overall noise.
sharpely’s Value Score uses five metrics:
| Metric | What It Measures | Why It Is Included |
| Book to Market (B/P) | Net asset value relative to market cap | The original Fama-French value factor; captures balance sheet cheapness |
| Earnings Yield (E/P) | Earnings relative to price (inverse of P/E) | The most widely used valuation proxy; captures earnings cheapness |
| Sales to Price (S/P) | Revenue relative to market cap | Useful for unprofitable or low-margin companies where E/P is distorted |
| FCF Yield | Free cash flow relative to market cap | Cash-based measure, harder to manipulate than earnings; captures true cheapness |
| Inverse of CAPE (3-year) | Cyclically adjusted earnings yield over 3 years | Reduces distortion from single-year earnings spikes; more stable signal |
Each of the five metrics is scored 0-100, then averaged equally, and the composite is rescored to produce the final Value Score between 0 and 100. A higher score means the stock is cheaper relative to peers across multiple valuation dimensions simultaneously.
An Important Transparency Note on Value
sharpely’s documentation makes an unusual and candid admission: if you build quintile portfolios from the Nifty 500 using the Value Score, higher quintiles did not meaningfully outperform lower quintiles over the past 10 years in India — though they did outperform strongly in the 3 years post the COVID-19 crash in March 2020.
This is worth understanding. The Value Score was designed based on academically proven methodology validated across decades of data from multiple global markets, not optimised to fit Indian historical data from the last 15 years. That is a deliberate and principled choice: overfitting a score to Indian historical data would produce impressive backtests but fragile real-world results. The global academic evidence for value as a factor is robust; the Indian 10-year history is too short to draw definitive conclusions either way.
The Price Momentum Score: Three Time Windows
The existence of momentum- the observation that stocks which have performed well over the past year tend to continue performing well over the next 3-12 months is one of the most robustly documented phenomena in financial markets. The original paper by Jegadeesh and Titman (1993), titled ‘Returns to Buying Winners and Selling Losers’, demonstrated this across US markets, and it has since been replicated globally.
The preferred academic proxy for momentum is total return over the past 12 months, minus the return in the most recent month. The subtraction of the last month’s return is intentional: extremely short-term price movements have a mean-reverting tendency, and excluding them prevents the momentum signal from picking up very recent noise.
sharpely’s Price Momentum Score combines three metrics to produce a more robust signal than any single window:
| Metric | Window | Why This Window |
| 12-Month Return minus 1-Month Return | 11 months of lookback | The standard academic momentum signal — captures medium-to-long-term price trend while avoiding short-term reversal noise |
| 6-Month Return | 6 months of lookback | Captures medium-term momentum, complements the 12-month signal, and provides a more recent directional read |
| Price Distance from 52-Week High | Rolling 52 weeks | Stocks closer to their 52-week high have stronger momentum; research shows this proximity is itself a predictive signal independent of raw return magnitude |
Note: for the 52-week high metric, lower distance from the high is better, meaning stocks near their yearly peak score higher. The standardisation step in the score calculation handles this direction flip automatically, so the final output is always higher = better.
The Quality Score: Three Dimensions of Business Health
Quality as an investment factor was formalised by Asness, Frazzini, and Pedersen in their 2013 paper, which demonstrated that stocks of safe, profitable, and growing companies systematically outperform the market. sharpely’s Quality Score is built directly from this framework, decomposing quality into three measurable components.
Profitability: Efficiency and Margins
Profitability captures how efficiently a business converts capital and revenue into earnings. sharpely uses five metrics:
Return on Equity (ROE): how much profit the business generates per rupee of shareholder equity.
Return on Assets (ROA): earnings relative to total assets; less sensitive to leverage than ROE.
Cash Flow Return on Assets (CFROA): operating cash flow relative to assets; cash-based version of ROA, harder to manipulate through accounting choices.
Operating Profit Margin: operating profit as a percentage of revenue; captures core business efficiency.
Operating Cashflow Margin: operating cash flow as a percentage of revenue; the cash-basis version of operating margin.
Growth: Improving Profitability Over Time
A profitable business that is becoming more profitable is qualitatively better than one with static or declining profitability, even if both appear equally strong at a point in time. sharpely captures this by looking at the 3-year change in each of the five profitability metrics above. A positive delta means the metric has improved over three years; a negative delta means it has deteriorated. Stocks where profitability is trending upward score higher on the growth dimension of quality.
Safety: Balance Sheet and Return Stability
Even a highly profitable business can be fragile if it carries excessive leverage or generates volatile returns. The safety component captures three metrics:
Volatility of daily returns (1 year): lower volatility stocks score better; consistent return generation is a sign of business stability.
Beta (vs Nifty 50, 1 year): lower beta means the stock moves less with the market; a safer business in relative terms.
Debt to Equity ratio: lower leverage means the business is less dependent on borrowed capital and has more resilience through downturns.
The three components, Profitability, Growth, and Safety, are each scored 0-100, then aggregated equally into the final Quality Score. A high Quality Score means the business scores well across all three dimensions simultaneously: profitable, improving, and stable.
The Earnings Momentum Score: When Earnings Back Up Price
Price momentum alone can be driven by sentiment, speculation, or liquidity. Earnings momentum, momentum backed by improving actual and expected earnings, is a fundamentally stronger signal because it connects price movement to underlying business performance.
sharpely calculates Earnings Momentum using three metrics:
| Metric | What It Captures | Data Freshness Note |
| Last Quarter EPS Growth (YoY) | Year-on-year growth in net income for the most recent quarter | Set to NA when the quarter changes, to avoid mixing fresh and stale data. NA stocks receive a neutral score of 50. |
| EPS Surprise | Actual EPS vs consensus analyst estimate for the most recent quarter | Positive surprise = market underestimated earnings. Set to NA if no analyst coverage or when quarter changes. NA scores = 50. |
| Earnings Upgrade (3M) | Current consensus EPS NTM estimate divided by the estimate 3 months ago | Captures whether analysts are revising expectations up or down. Upgrade = positive; downgrade = negative. |
Two important design choices in the Earnings Momentum Score are worth noting. First, stale data is actively avoided: EPS growth and EPS surprise are set to NA as soon as the quarter changes, preventing the score from using outdated quarterly data. Momentum is a fast-decaying signal; using last quarter’s results when this quarter’s are available would meaningfully degrade the signal quality.
Second, stocks without analyst coverage are not penalised. EPS surprise and earnings upgrade require consensus estimates, which only exist for covered stocks. Uncovered stocks receive a neutral score of 50, acknowledging that absence of data is different from evidence of poor momentum.
The Earnings Quality Score: How Reliable Are the Numbers?
Earnings quality asks a more fundamental question than other scores: can you trust what the income statement says? A company can report strong earnings while using aggressive accounting, failing to convert earnings to cash, or generating one-off income that will not repeat. Earnings quality quantifies this reliability risk.
sharpely uses three metrics:
Beneish M-Score: Developed by Professor Messoud Beneish, this score uses eight financial variables to detect potential earnings manipulation. An M-score above –1.78 is a red flag indicating possible manipulation. This is a well-established academic model used by forensic accountants and institutional investors globally.
Cash Flow Accrual Ratio: Measures the gap between accounting earnings (net income) and cash earnings (operating cash flow). Large positive accruals suggest earnings are running significantly ahead of cash — a warning sign that reported profitability may not persist. Lower (more negative) is better.
Earnings Persistence: A proprietary metric from FactSet that assesses how repeatable and controllable a company’s earnings are, based on recurring cash-basis income and changes in net operating assets. High persistence means earnings are likely to continue; low persistence means they are volatile or unpredictable.
The Price and Earnings Momentum Score: The Combined Signal
The Price and Earnings Momentum Score is the most comprehensive momentum signal on sharpely, combining all six metrics from both the Price Momentum Score and the Earnings Momentum Score into a single composite.
| Source | Metrics Included |
| From Price Momentum Score | 12M Return minus 1M Return | 6-Month Return | Price Distance from 52-Week High |
| From Earnings Momentum Score | Last Quarter EPS Growth (YoY) | EPS Surprise | Earnings Upgrade (3M) |
The logic behind combining both: price momentum tells you what the market is doing; earnings momentum tells you what the business is doing. Stocks where both are strong simultaneously- price trending up and earnings expectations improving- are the highest-conviction momentum setups. Technical trends that are backed by fundamental improvement tend to be more sustained and less prone to sudden reversal than price-only momentum.
Multi-Factor Scores: Combining Factors Into One Number
The single-factor scores answer specific questions: is this stock cheap? Is it showing momentum? Is it financially healthy? Multi-factor scores combine these dimensions into a single composite, allowing you to identify stocks that score well across multiple factors simultaneously.
sharpely has four multi-factor scores, each built using the same score-aggregate-score methodology applied to the underlying single-factor scores:
| Score | Factors Combined | Best Used For |
| QV Score | Quality + Value | Classic value investing with quality filter; avoids value traps by requiring financial strength alongside cheapness |
| QM Score | Quality + Momentum | Recommended for Indian market context; quality filters out operationally weak stocks that momentum would otherwise include |
| VM Score | Value + Momentum | Avoids value traps by requiring momentum confirmation; cheap stocks that the market has started to recognise |
| QVM Score | Quality + Value + Momentum | The broadest single composite; stocks scoring well across all three factors simultaneously are rare and high-conviction |
An Honest Limitation of Multi-Factor Scores
Multi-factor scores can be misleading when a stock scores extremely high on one factor and only average on others. For example, a stock scoring 100 on Value and 65 on Momentum will have a VM Score above 70, which appears strong even though its momentum is only average and other stocks may have both good value (score 90) and good momentum (score 85).
This is not a flaw in the construction; it is an inherent property of composite scores. The right way to use multi-factor scores is as a first-pass filter, not as a definitive ranking. A high QVM score tells you the stock deserves research attention across all three dimensions; it does not mean it dominates on every individual factor.
Why There Is No Standalone Growth Score
If you are familiar with factor investing, you will notice that a dedicated Growth score is absent. This is intentional, and the reasoning is worth understanding.
Empirical research has consistently shown that historical earnings growth as a standalone factor does not generate a reliable risk premium. In other words, portfolios of high-growth stocks do not systematically outperform portfolios of low-growth stocks over long periods, in contrast to Value, Momentum, and Quality, which do.
This does not mean growth is irrelevant. Rather, the valuable aspects of growth are already captured within other scores: profitability growth is one of the three components of the Quality Score, and earnings momentum, which captures improving earnings expectations, is built into both the Earnings Momentum Score and the Price and Earnings Momentum Score. Growth signals that have proven predictive are used; those that have not are excluded.
Building Your Own Score with sharpely’s Factor Model
Understanding how sharpely’s pre-built scores are constructed leads naturally to the next question: what if you want a score that reflects your own factor weights or includes metrics that the default scores do not?
sharpely’s Factor Model tool lets you build exactly this. Instead of using the default composite, you can define your own weights, placing more emphasis on momentum than value, or prioritising safety within quality, or combining earnings quality with price momentum in proportions that reflect your specific investment philosophy. Check an example below.

The process mirrors the score-aggregate-score methodology described above, but with user-defined weights and metric selections. You build the composite, and sharpely scores the full universe against it, producing a ranked list of stocks by your custom factor score. You can then backtest it to see how a portfolio selected by your score would have performed historically, across different market cycles.
The combination of transparent pre-built scores and the ability to customise them is what makes sharpely’s factor infrastructure genuinely useful for serious investors: you can start with academically rigorous defaults, understand exactly what they measure, and modify them deliberately based on your own research and market view.
Key Takeaways
Every score uses the same three-step method: score, aggregate, rescore. This produces comparable, consistent outputs across all single and multi-factor scores. Higher is always better, regardless of the underlying metric’s direction.
Single factor scores are built from multiple metrics, not one. Value uses five metrics. Momentum uses three. Quality uses eleven metrics across three components. The composite is more robust than any individual ratio.
The methodology is research-derived, not backtest-optimised. sharpely explicitly chose to base scores on globally validated academic research rather than fitting them to 10-15 years of Indian market data, even when that means some scores show mixed performance in the Indian historical record.
Earnings scores add a fundamental layer to momentum. The Earnings Momentum Score and Earnings Quality Score extend beyond price data into the reliability and trajectory of the underlying business performance.
Multi-factor scores combine dimensions but have known limitations. A high composite score does not mean a stock dominates on every individual factor. Use them as a first-pass filter and examine the underlying single-factor scores for stocks that pass.
You can build your own score. sharpely’s Factor Model lets you define custom weights, choose your own metric combinations, and backtest the resulting strategy, turning the same methodology used for the pre-built scores into a tool for your own systematic investment framework.