
Most mutual fund comparisons look like this: check the 3-year return of Fund A, check the 3-year return of Fund B, pick the higher number. Done.
It is fast. It feels logical. And it routinely leads investors to the wrong conclusion.
Point-to-point returns are the single most misleading metric in mutual fund analysis, not because the numbers are wrong, but because they are profoundly incomplete. They tell you what a fund returned between two specific dates. They say nothing about whether that return was consistent, how much risk was taken to earn it, what it cost, or whether the fund is doing something genuinely different from the one sitting next to it in your portfolio.
This article covers the right framework for comparing two mutual funds, the metrics that actually differentiate funds, what each one reveals, and how to use sharpely’s Mutual Fund Overlap Calculator to answer the one question most comparison tools completely skip: are these two funds even doing different jobs?
Step 1: Confirm You Are Comparing Within the Same Category
Before any metric comparison, confirm both funds belong to the same SEBI category. Comparing a large-cap fund to a flexi-cap fund on 3-year returns tells you almost nothing useful; the two funds are playing a different game with a different mandate, a different benchmark, and a different risk profile. The comparison will produce a number, but the number is meaningless.
The correct benchmark also changes by category. A large-cap fund should be benchmarked against the Nifty 100 or Nifty 50. A mid-cap fund against the Nifty Midcap 150. A flexi-cap fund against the Nifty 500. Comparing two funds’ alpha or Sharpe Ratio without confirming they share the same benchmark produces comparisons that are arithmetically accurate and analytically useless.
The category filter comes first, always. Every metric that follows is only meaningful within a peer group, not across categories.
Step 2: Compare Consistency, Not Just Returns
Once category is confirmed, the first performance metric to compare is rolling return beat percentage versus category average, not point-to-point CAGR.
Why Rolling Returns Beat Point-to-Point
A fund’s 5-year CAGR is a single data point calculated from one start date to one end date. Change either date by a few months, and the number changes, sometimes significantly. Two funds with identical 5-year CAGR can have dramatically different consistency: one may have delivered steady outperformance across the entire period, the other may have had one or two exceptional years propping up an otherwise mediocre average.
Rolling returns fix this by measuring the fund’s annualised return for every possible holding period of a fixed length within a historical window, producing hundreds of data points rather than one. The beat percentage then tells you: in what proportion of those periods did Fund A outperform its category average? A fund with an 80% rolling beat rate has been consistently better than its peers across most market entry points. A fund with a 35% beat rate has underperformed its peers more often than it has outperformed, regardless of its headline CAGR. For example, check the rolling return beat percentage vs category and benchmark for Parag Parikh Flexicap Fund.
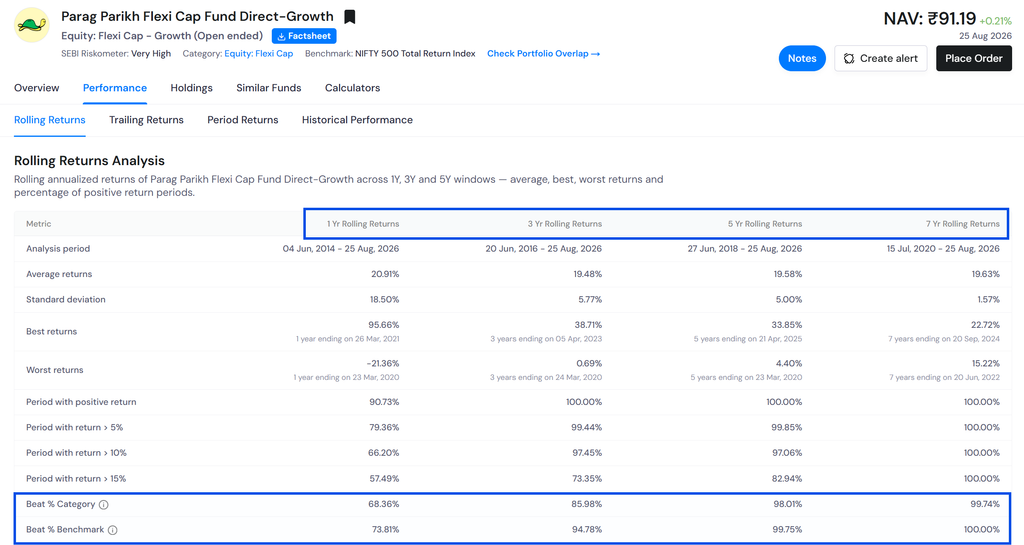
This matters especially for SIP investors, who enter at multiple points rather than one fixed date. Rolling return consistency is the closest approximation to the actual SIP investor experience that any single metric can provide.
What to Look For
When comparing two funds on rolling returns, focus on:
Beat percentage over 3-year and 5-year windows: 60%+ is consistent; 70%+ is strong. If Fund A has a 72% 5-year rolling beat rate and Fund B has a 41% beat rate despite similar CAGR, Fund A is the more reliable performer by a significant margin.
Minimum rolling return: The worst 3-year or 5-year outcome a historical investor could have experienced. Fund A, with a minimum 3-year rolling return of +4%, and Fund B, with a minimum of –8%, carry very different downside risk profiles, a difference that point-to-point returns cannot surface.
Average rolling return vs category average: Confirms whether the beat percentage is driven by genuine outperformance or simply by lower volatility in a declining category.
Step 3: Compare Risk, Not Just Return
Two funds with the same return are not equally good if one achieved it with significantly more volatility than the other. The risk comparison requires three metrics looked at together.
| Metric | What It Measures | How to Use It in Comparison |
| Sharpe Ratio | Return per unit of volatility (higher = more efficient) | Compare within the same category — the fund with higher Sharpe delivered the same or better returns with less volatility |
| Standard Deviation | How much the fund’s returns fluctuate (lower = smoother) | Higher std dev is expected in small-cap vs large-cap — always compare within peer group, never across categories |
| Alpha | Return above what the benchmark exposure alone would have generated | Positive alpha means the manager added value beyond simply riding market direction; compare to category benchmark, not Nifty 50 |
| Beta | Sensitivity to benchmark movements | Know it before buying — a high-beta fund will amplify both gains and losses relative to the index |
| Up/Down Capture Ratio | How much of benchmark gains (up) and losses (down) the fund captured | Ideal: up capture > 100, down capture < 100 — the fund participates more in rallies than it suffers in corrections |
The most practically useful combination when comparing two funds of the same category: Sharpe Ratio + Down Capture Ratio together. A fund that delivered a higher Sharpe with a lower down capture than its peer has been both more efficient and more defensive, a genuinely better risk-return profile, not just a higher return number.
Step 4: Compare Cost – The Only Guaranteed Return Difference
The expense ratio is the only metric in a mutual fund comparison that is certain and compounding. Market returns are uncertain. Alpha is unpredictable. But the expense ratio is a guaranteed annual drag, deducted daily from the fund’s NAV regardless of market conditions.
When comparing two funds within the same category, the expense ratio differential compounds significantly over time. A fund with a 0.5% lower expense ratio than its peer, all else being equal, will compound that cost advantage into a meaningful return difference over a 10 or 15-year holding period.
Direct vs Regular Plans
Before comparing expense ratios between two funds, confirm you are comparing the same plan type. Direct plans carry no distributor commission and have significantly lower expense ratios than regular plans, typically 0.5% to 1.0% lower annually. Comparing the direct plan of Fund A to the regular plan of Fund B is not a meaningful comparison. Both plans of both funds should be compared on a like-for-like basis.
Using Relative Rather Than Absolute Thresholds
Rather than applying an absolute expense ratio threshold — ‘below 1%’ — the more useful comparison is which fund has a lower expense ratio relative to its category peers. A small-cap fund charging 1.4% may be below the category median. A large-cap fund charging 1.0% may be above it. The category-relative cost position is what matters, not the absolute number in isolation.
Step 5: Check Portfolio Overlap – The Question Most Investors Never Ask
Performance metrics, risk metrics, and cost all compare how well each fund does its job individually. Portfolio overlap asks a different, and equally important, question: are these two funds doing the same job?
This is the most commonly skipped step in mutual fund comparison, and it is the one most likely to reveal that two funds an investor believes are diversifying each other are actually holding largely the same underlying stocks.
What Portfolio Overlap Means
Portfolio overlap measures the percentage of common holdings between two funds by combined portfolio weight. If Fund A and Fund B both hold significant positions in the same five or six companies, a large portion of the investor’s combined capital is effectively concentrated in those names, regardless of the fact that it is spread across two separate fund names, two separate NAVs, and two separate expense ratios.
The overlap problem is particularly acute in certain category combinations:
Large-cap fund + Nifty 50 index fund: both draw from the same universe of the top 50–100 companies by market cap. Overlap of 50% or more is common. An investor holding both is paying two expense ratios for what is largely one portfolio.
Flexi-cap fund + multi-cap fund: both may gravitate toward the same large-cap stocks in their top holdings, particularly in risk-off environments when fund managers reduce mid- and small-cap exposure. Overlap can be higher than the category labels suggest.
What the Numbers Mean
| Overlap Range | What It Means | What to Do |
| Below 30% | Healthy, funds are doing genuinely different jobs | No action needed. Genuine diversification confirmed |
| 30% to 50% | Moderate, meaningful duplication exists | Review whether both funds serve distinct portfolio roles |
| Above 50% | High, funds are largely investing in the same stocks | Consider consolidating; you are paying twice for one exposure |
A Real Example: What 31.8% Overlap Looks Like
Take the comparison between Parag Parikh Flexi Cap Fund Direct-Growth and HDFC Flexi Cap Direct Plan-Growth, two of the most popular funds in the flexi-cap category.
sharpely’s Mutual Fund Overlap Calculator shows that 31.8% of the combined portfolio is common to both funds. That means roughly one-third of the capital invested across both funds is sitting in the same stocks, including shared large positions in ICICI Bank, Axis Bank, Kotak Mahindra Bank, HCL Technologies, and others. A total of 25 stocks appear in both portfolios, with the largest shared holding, ICICI Bank, at 5.96% in one fund and 6.97% in the other.
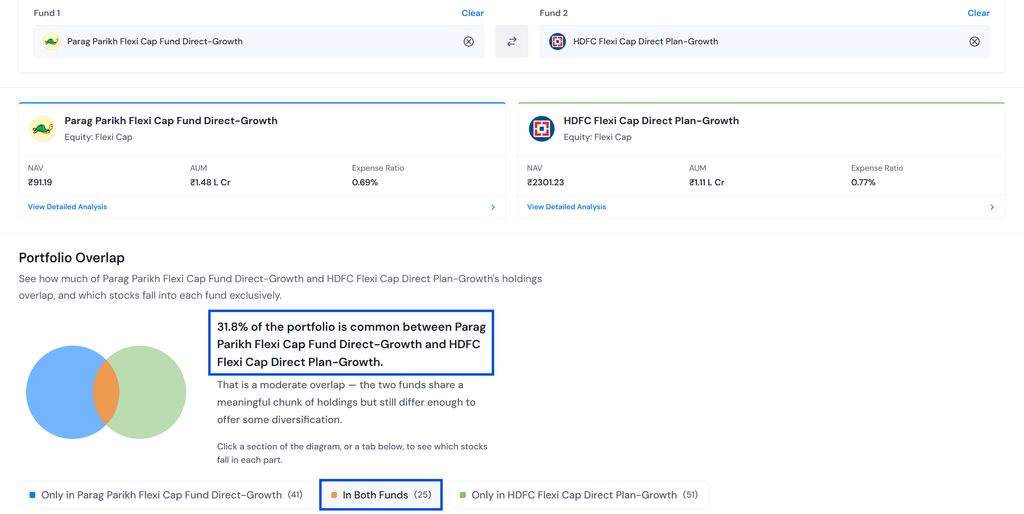
At 31.8%, this falls in the moderate overlap range; the two funds share a meaningful chunk of holdings but still offer genuine differentiation in the remaining portfolio. Parag Parikh’s distinctive international equity allocation and HDFC Flexi Cap’s different sector weightings mean the non-overlapping portions of the portfolio are doing genuinely different work. Whether holding both makes sense depends on whether the investor wants that specific combination of exposures, or whether one fund alone covers the portfolio role adequately.
This is the kind of analysis that is impossible to do manually from factsheet PDFs — and the kind that takes seconds with the right tool.
Check the overlap between any two mutual funds on sharpely’s Mutual Fund Overlap Calculator
Putting It Together: The Right Comparison Framework
| Step | What to Compare | Why It Matters |
| 1 | Fund category: confirm both are in the same SEBI category | All subsequent comparisons are meaningless across different categories |
| 2 | Rolling return beat % vs category average (3Y and 5Y) | Reveals consistency, not just whether the fund returned well, but whether it did so reliably across many entry points |
| 3 | Sharpe Ratio + Downside Capture Ratio within category | Shows risk efficiency: which fund delivered returns with less volatility and better downside protection |
| 4 | Alpha vs category benchmark (not Nifty 50) | Confirms whether the manager added value beyond market exposure, the justification for paying active management fees |
| 5 | Expense ratio: Within category, direct vs direct | The only guaranteed return differential, compounds into significant corpus difference over long holding periods |
| 6 | Portfolio overlap between the two funds | Answers whether the two funds are actually diversifying each other or duplicating exposure under different names |
The Three Comparison Mistakes Most Investors Make
Mistake 1: Comparing on 1-year returns after a strong market run. A fund that has outperformed over the last 12 months in a bull market may simply have had higher beta, more market sensitivity, rather than genuine skill. One-year returns in a rising market reward risk-taking, not quality. Always extend the comparison to at least 3 years and use rolling returns rather than point-to-point.
Mistake 2: Using the same fund from a different plan type in the comparison. Comparing Fund A’s direct plan to Fund B’s regular plan produces a return differential that is partly genuine performance and partly a cost difference between plan types. Always compare direct-to-direct or regular-to-regular.
Mistake 3: Stopping at performance and cost without checking overlap. An investor who compares Fund A and Fund B on every return and risk metric and then buys both — without checking whether they hold the same stocks — has done 80% of the right analysis and missed the conclusion. The overlap check determines whether buying both funds makes portfolio sense or simply doubles the expense without adding diversification.
Key Takeaways
Start with category, not returns. Cross-category comparisons are analytically meaningless. Confirm both funds share the same SEBI mandate before comparing any metric.
Rolling return beat percentage reveals consistency; CAGR conceals it. A fund with a 70%+ rolling beat rate over 5 years is a consistently strong performer. A fund with a 35% beat rate has been outperformed by its category peers more often than not, regardless of headline CAGR.
Risk comparison requires Sharpe and Downside Capture together. A fund that delivered similar returns with lower volatility and better downside protection is a better risk-adjusted choice — something raw return numbers never show.
Expense ratio is the only guaranteed return difference. It compounds annually across every year you hold the fund. Always compare direct-to-direct within the same category.
Portfolio overlap is the most skipped and most important check. Two funds holding 50%+ of the same stocks are not diversifying each other. You are paying two expense ratios for one effective portfolio. Check overlap before finalising any two-fund comparison.
sharpely’s Mutual Fund Overlap Calculator shows you the exact overlap percentage, every shared stock, and comparative metrics for any two funds side by side- the starting point for a comparison that goes beyond the headline return number.