
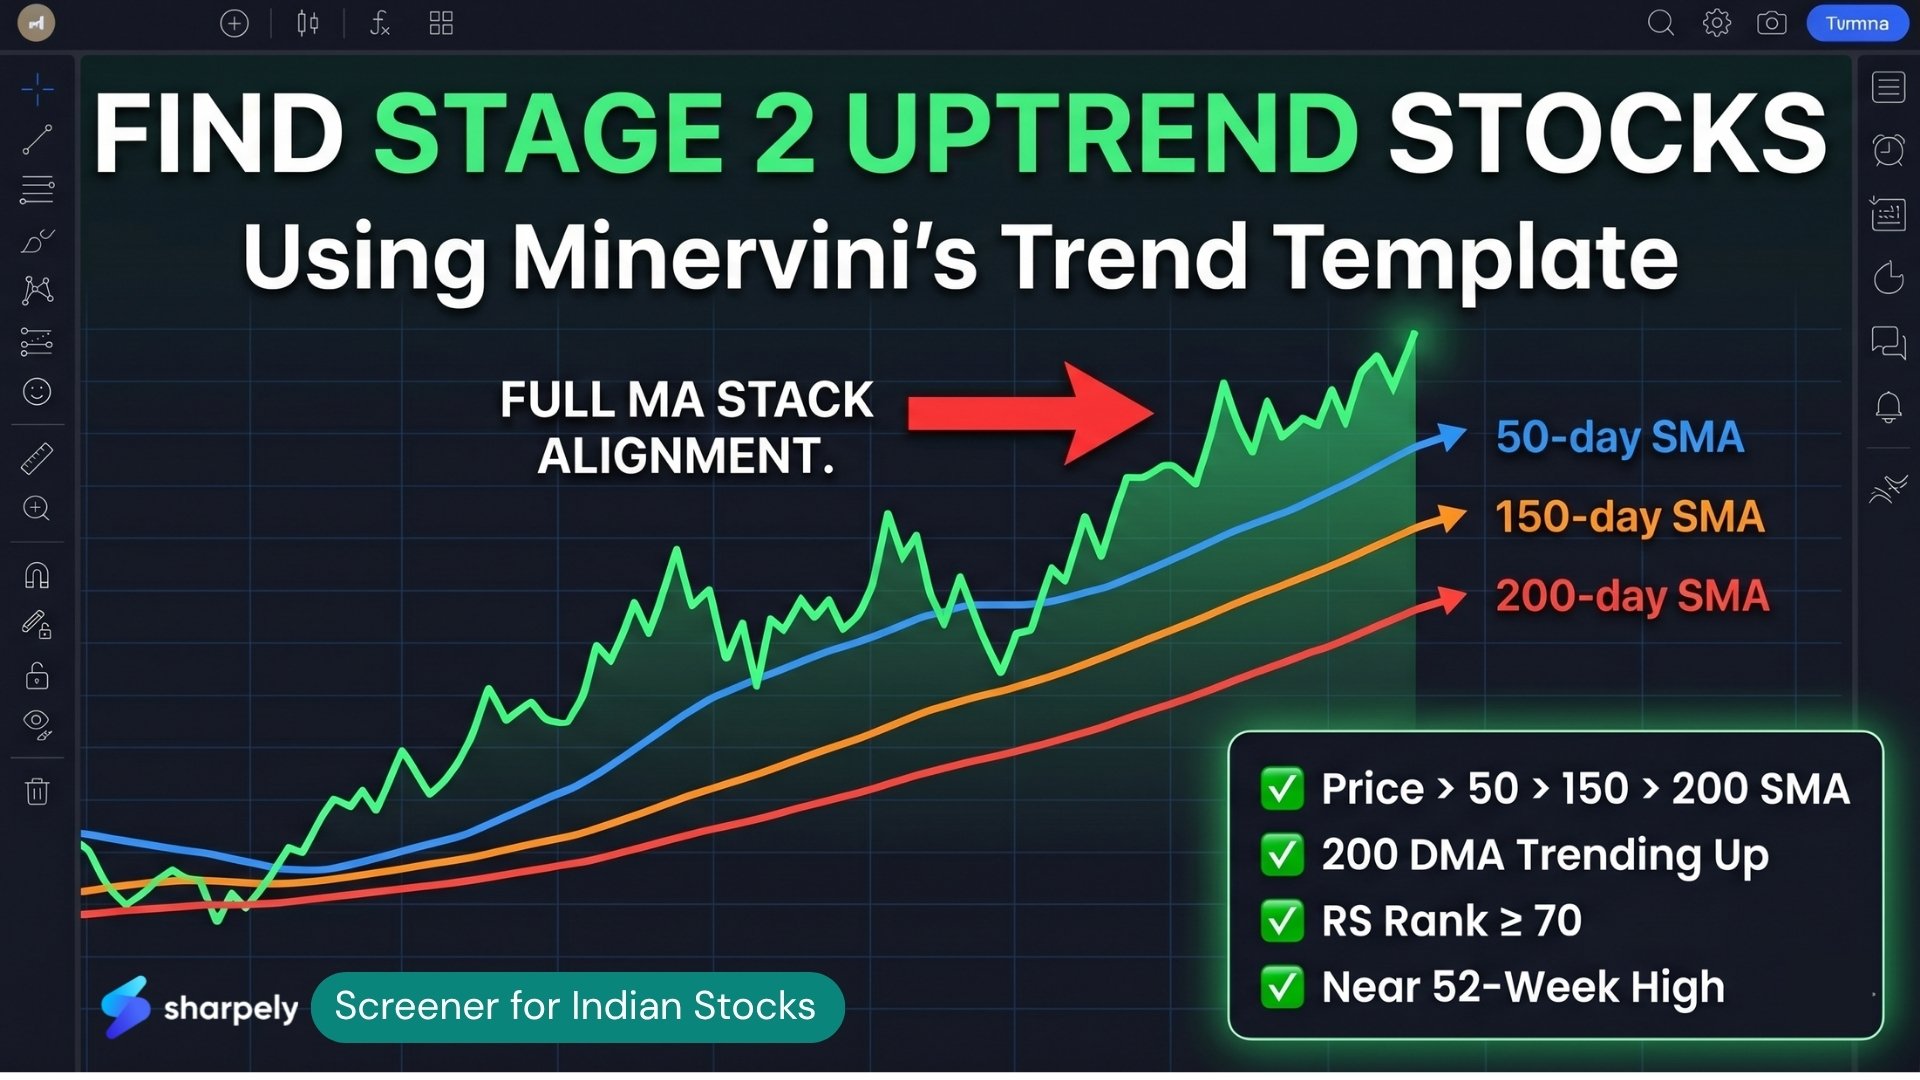
Most traders look for stocks that are going up. Mark Minervini looks for something more specific — stocks that are in a confirmed Stage 2 uptrend, where every timeframe is aligned, institutions are accumulating, and the stock is already outperforming the broader market.
The tool he uses to identify these stocks is called the Minervini Trend Template — an 8-criterion checklist that he developed as part of his SEPA (Specific Entry Point Analysis) system. It is one of the most widely referenced stock screening frameworks among momentum traders globally, and it translates directly into a screener you can run on Indian stocks.
This article covers where the concept comes from, what each of the 8 criteria actually means, and how to set it up on sharpely’s Super Screener.
Where the Concept Comes From — Stan Weinstein’s 4 Stages
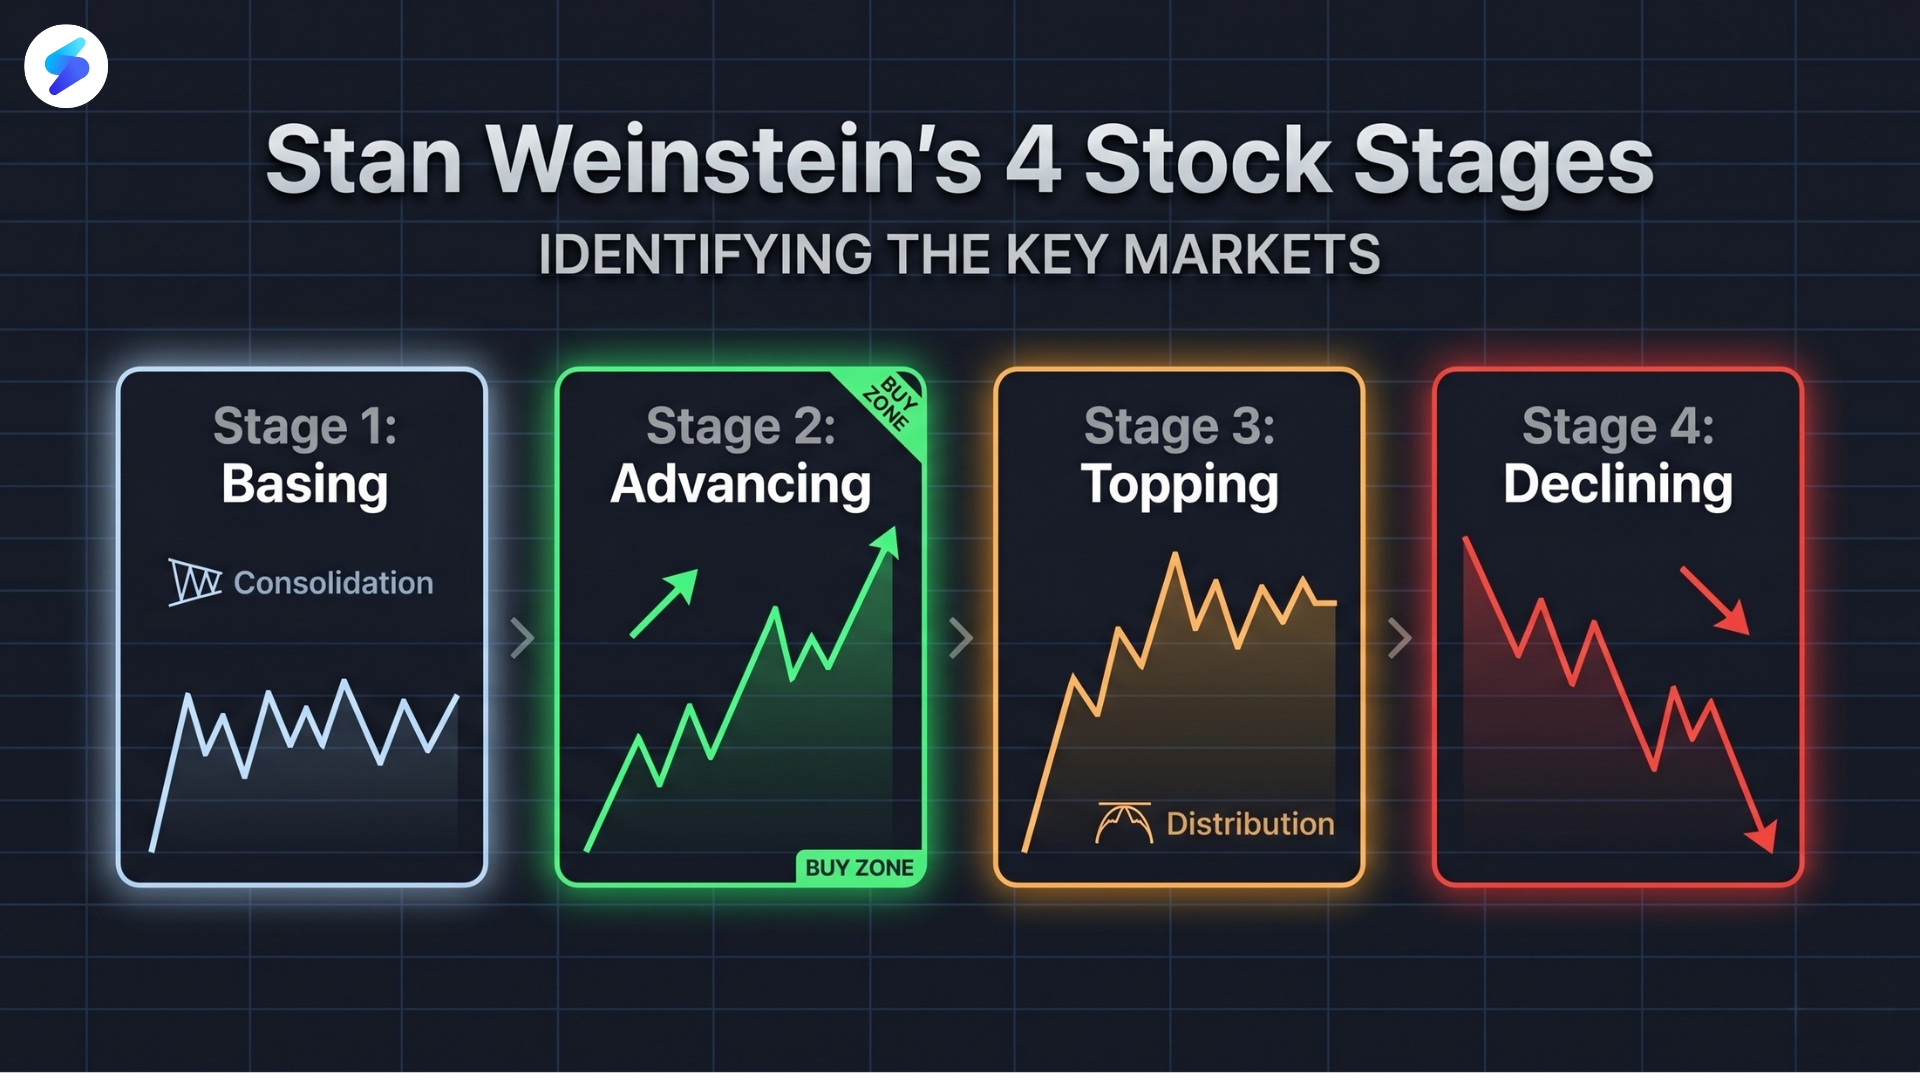
The foundation goes back to 1988, when Stan Weinstein published Secrets for Profiting in Bull and Bear Markets. Weinstein argued that every stock — regardless of sector, size, or market cycle — moves through four distinct stages, in order.
Stage 1 — Basing (Consolidation): The stock has stopped falling and is trading sideways. Volume is low. The stock is ignored. Institutions may be quietly accumulating, but there is no visible upward momentum yet.
Stage 2 — Advancing (Markup): The stock breaks out of its base. Price makes higher highs and higher lows. The 200-day moving average turns up. Volume picks up on up days. This is where the majority of gains happen, and it is the only stage Minervini buys in.
Stage 3 — Topping (Distribution): The stock stalls near its highs. Price starts to chop sideways at the top. Volume is heavy but the stock is not going anywhere. Smart money is selling to late buyers. Many retail investors mistake this for a consolidation before another leg up — and get caught.
Stage 4 — Declining (Capitulation): The stock breaks down. Price makes lower lows. The moving averages roll over and slope down. This stage ends only when the stock completes a new Stage 1 base.
The insight is simple but powerful: you only want to own stocks in Stage 2. The question is, how do you identify Stage 2 precisely enough to act on it? That is what Minervini built the Trend Template to answer.
Minervini’s Trend Template: The 8 Criteria, Explained
Minervini formalised Weinstein’s Stage 2 concept into a precise, testable checklist. Every stock he considers must pass all 8 criteria before it even reaches his watchlist. Here is what each one is checking and why it matters.
Criterion 1: Price is above the 150-day SMA and the 200-day SMA
The 200-day Simple Moving Average (SMA) is the most widely watched long-term trend indicator. When the price is above it, the stock is in a long-term uptrend. The 150-day SMA acts as a shorter confirmation — it sits between the 50-day and 200-day and tells you the intermediate trend is also up. Both must be cleared simultaneously.
Criterion 2: The 150-day SMA is above the 200-day SMA
This confirms that the intermediate trend is stronger than the long-term trend — meaning the stock has been gaining momentum, not just recovering. When the 150-day crosses above the 200-day and stays there, it signals that the uptrend has duration behind it, not just a recent spike.
Criterion 3: The 200-day SMA is trending upward for at least 1 month
A stock can trade above its 200-day SMA even while that average is still sloping downward — which means the trend is not truly established yet. This criterion demands that the 200-day SMA itself is rising, not just that the price is above it. Minervini prefers 4–5 months of upward slope, but a minimum of 1 month is required.
Criterion 4: The 50-day SMA is above both the 150-day and 200-day SMAs
The 50-day SMA reflects short-term trend direction. When it is above both longer-term averages, the short-term momentum is stronger than the intermediate and long-term trends — which is exactly what you want to see in the early-to-middle stages of an advance. This is the beginning of what traders call full MA stack alignment.
Criterion 5: Price is above the 50-day SMA
Combined with criteria 1 and 4, this completes the full moving average stack: Price > 50 DMA > 150 DMA > 200 DMA. Every timeframe — short, intermediate, and long — is pointing in the same direction. This is the structural backbone of a Stage 2 uptrend.
Criterion 6: Price is at least 25% above its 52-week low
This ensures the stock has already broken out of its base and made a meaningful move. A stock sitting just 5% above its 52-week low has not confirmed anything yet — it may still be in Stage 1. A 25% move above the low is evidence that buyers are genuinely in control and the advance has begun.
Criterion 7: Price is within 25% of its 52-week high
This is equally important — it tells you the stock is still in the markup phase, not topping. A stock that is 60% below its 52-week high may have been in Stage 2 at some point, but it has likely already entered Stage 3 or Stage 4. You want stocks near their highs, not far from them. The closer to the 52-week high, the better.
Criterion 8: RS Rank of 70 or above
RS Rank — Relative Strength Rank — measures how a stock’s price performance over the past 12 months compares to every other stock in the universe. An RS Rank of 70 means the stock has outperformed 70% of all stocks over that period. This filter ensures you are looking at genuine market leaders, not just stocks that happen to be above their moving averages in a rising tide.
Together, these 8 criteria confirm that a stock is trending up on every timeframe simultaneously, is not extended to the point of being dangerous, and is showing stronger performance than the vast majority of the market. That is Stage 2, precisely defined.
What Stage 2 Stocks Look Like in Practice
A stock that passes all 8 criteria will have a very specific look on a chart. The moving averages are fanned out in ascending order — 50-day on top, then 150-day, then 200-day, all sloping upward. Price is above all of them. The stock has been making higher highs and higher lows over multiple months. It is not far from its yearly peak. Check the image below.
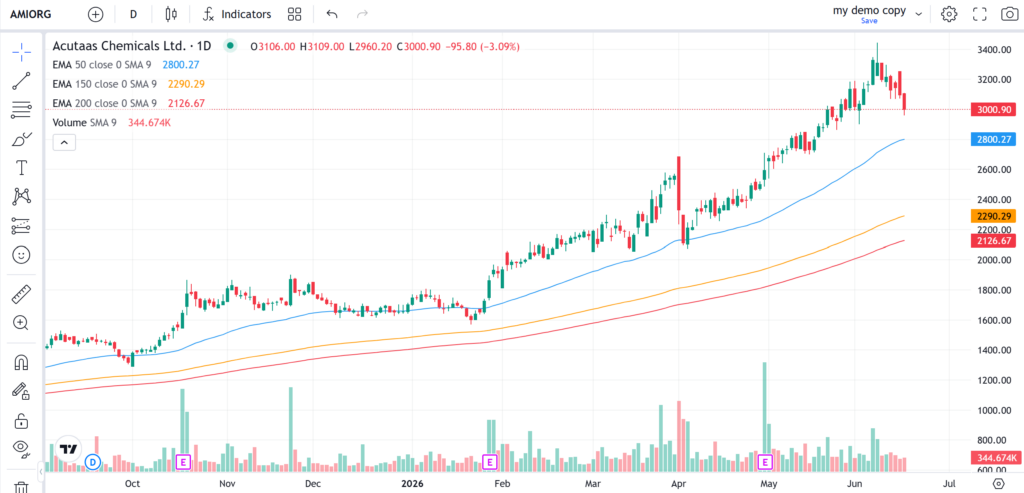
What gets filtered out is just as important. Stocks in a sideways range fail criteria 2, 3, and 4. Stocks recovering from a large drawdown often fail criteria 6 and 7. Stocks where the short-term has rolled over, while the long-term looks fine, will fail criterion 5. Stocks that are just going up with the market but not outperforming it will fail criterion 8.
The Trend Template is a starting universe filter, not an entry signal. Once you have a list of stocks passing all 8 criteria, you are looking at confirmed Stage 2 candidates. The next step is to find a specific entry point within that list — and the most well-known method Minervini uses for this is the Volatility Contraction Pattern (VCP). If you want to understand how to time entries within a Stage 2 trend, we have covered the VCP in detail here.
For Indian markets specifically, with over 5,000 listed stocks, running this screen cuts the universe down to a small, focused list of stocks that are behaving exactly as Stage 2 should. That is where your research time is best spent.
How to Run This Screen on sharpely’s Super Screener
sharpely’s Super Screener lets you build the full Trend Template using its condition builder. Here are the exact filter conditions to enter:
| # | Filter | Condition |
| 1 | Close vs 200 DMA | Close > 200 DMA |
| 2 | Close vs 150 DMA | Close > 150 DMA |
| 3 | 150 DMA vs 200 DMA | 150 DMA > 200 DMA |
| 4 | 50 DMA vs 150 DMA | 50 DMA > 150 DMA |
| 5 | 50 DMA vs 200 DMA | 50 DMA > 200 DMA |
| 6 | Close vs 50 DMA | Close > 50 DMA |
| 7 | % above 52-week low | ≥ 25% |
| 8 | % below 52-week high | ≤ 25% (within 25% of 52-week high) |
| 9 | 200 DMA slope | 200 DMA today > 200 DMA 21 periods ago |
| 10 | Relative performance | Top 30% of universe (RS Rank ≥ 70 proxy) |
A few implementation notes:
On the 200 DMA slope (Filter 9): Set 200 DMA today greater than 200 DMA 21 periods ago. This captures the ‘trending upward for at least 1 month’ condition. For a stricter version, use 63 periods ago (3 months) — the signal will be fewer stocks but higher quality.
On Relative Strength (Filter 10): If a direct RS Rank filter is available, use RS Rank ≥ 70. As a proxy, filter for stocks whose 1-year price return is above the median of the screener universe — this approximates the top 30-30% cutoff.
On Moving Average type: All moving averages in the Trend Template are Simple Moving Averages (SMA), not Exponential Moving Averages (EMA). Use the SMA version if sharpely offers both. Here is what all the conditions together look like.
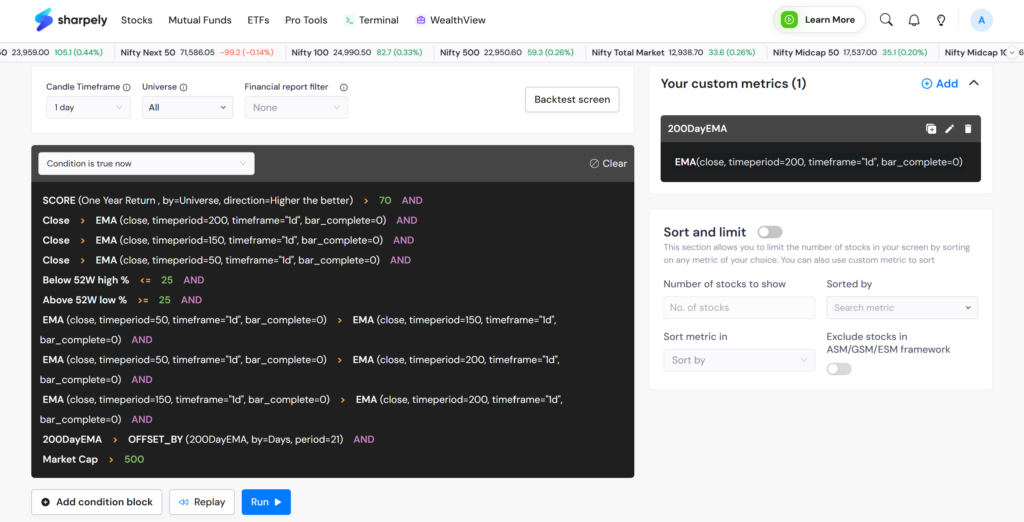
The screen sharpely has already been built using these conditions is ready to use — no need to set it up from scratch. Check it below.
What to Do with the Results
The list of stocks that pass all 8 criteria is your Stage 2 watchlist. These are stocks that have confirmed upward momentum across every timeframe, are near their 52-week highs, and are outperforming most of the market.
This is not a buy list. It is the pool from which you do your actual research — checking fundamentals, studying the chart for a proper base or consolidation pattern, and waiting for a specific, low-risk entry point.
The most natural next step after identifying Stage 2 stocks is to look for a VCP (Volatility Contraction Pattern) setup within the list — a specific consolidation structure that signals supply is drying up before a potential breakout. We have covered the VCP in detail in a separate article: Volatility Contraction Pattern (VCP): A Rule-Based Screener Built for High Quality Breakouts
Run the screen regularly, especially after market corrections, when new stocks emerge from their bases into Stage 2. The list will change as market conditions change, which is exactly how it should work.
Key Takeaways
Weinstein identified the four stages. Stage 2 is the only stage where you want to own stocks — it is where the majority of gains happen in any market cycle.
Minervini built the precise checklist. The Trend Template’s 8 criteria define Stage 2 in exact, testable terms — not as a gut feel but as a set of conditions every qualifying stock must meet simultaneously.
The full MA stack is the structural backbone. Price > 50 DMA > 150 DMA > 200 DMA, all sloping up, means every timeframe is aligned. Nothing is left to interpretation.
The Trend Template filters out, not just in. Sideways stocks, recovering stocks, extended stocks, and underperforming stocks all get eliminated. What is left is a focused, high-quality watchlist.
sharpely’s Super Screener lets you run this on the full Indian listed universe. The screen is already built. Use the link above, run it, and start with the stocks that clear all 8 criteria.
Related reading
- Volatility Contraction Pattern (VCP): A Rule-Based Screener Built for High Quality Breakouts
- Results Season Is Here: Are You Looking at the Right Numbers?
- Cup and Handle Pattern: Rules, Examples and How to Screen for It
- CANSLIM Strategy Explained: A Proven Formula to Find Winning Stocks
- How to Time the Lump Sum Investment in Your Mutual Fund Portfolio