
Two investors can each hold five mutual funds, look equally diversified on paper, and show similarly attractive returns — and one of them could be making two quiet, expensive mistakes the other has avoided. Not because one investor is smarter. Simply because nobody told them to check two specific things.
This article is about those two things: rolling return consistency and mutual fund portfolio overlap. Neither is complicated. Both are free to check. And almost no one checks them.
Mistake 1: Trusting CAGR Without Checking Rolling Returns
CAGR (Compound Annual Growth Rate) is the number every fund factsheet, every investing app, and every advisor pitch leads with. It tells you the annualised return between two fixed points in time: the day you (hypothetically) invested, and the day you checked.
What CAGR does not tell you is how the fund got there. Two funds can show an identical 15% CAGR over five years through completely different journeys. One might have delivered a steady 13-17% every single year. The other might have had one extraordinary year that single-handedly pulled up an otherwise mediocre average — three weak years, one outstanding year, and a final number that looks just as good as the consistent fund.
This is exactly the blind spot rolling returns are built to expose. Instead of measuring performance between two fixed dates, rolling returns measure the fund’s return for every possible start date within a period — say, every 3-year stretch starting each day over the last ten years. The result is not one number but a distribution of outcomes, which tells you how the fund performed regardless of when an investor entered.
This matters enormously for anyone investing via SIP, because your entry point is never the single clean start date used in a CAGR calculation. You are entering monthly (or weekly or daily), across market cycles, so what you actually care about is how the fund has performed across many different starting points, not just one.
The metric that converts this into something usable is the rolling return beat percentage versus category average — what percentage of all rolling periods did the fund beat its category peers. A fund that beats its category 80% of the time across rolling 3-year windows is demonstrating consistency. A fund that beats its category only 40% of the time, despite a headline CAGR that looks similar, is telling you its strong long-term numbers may be carried by a few exceptional phases rather than steady skill.
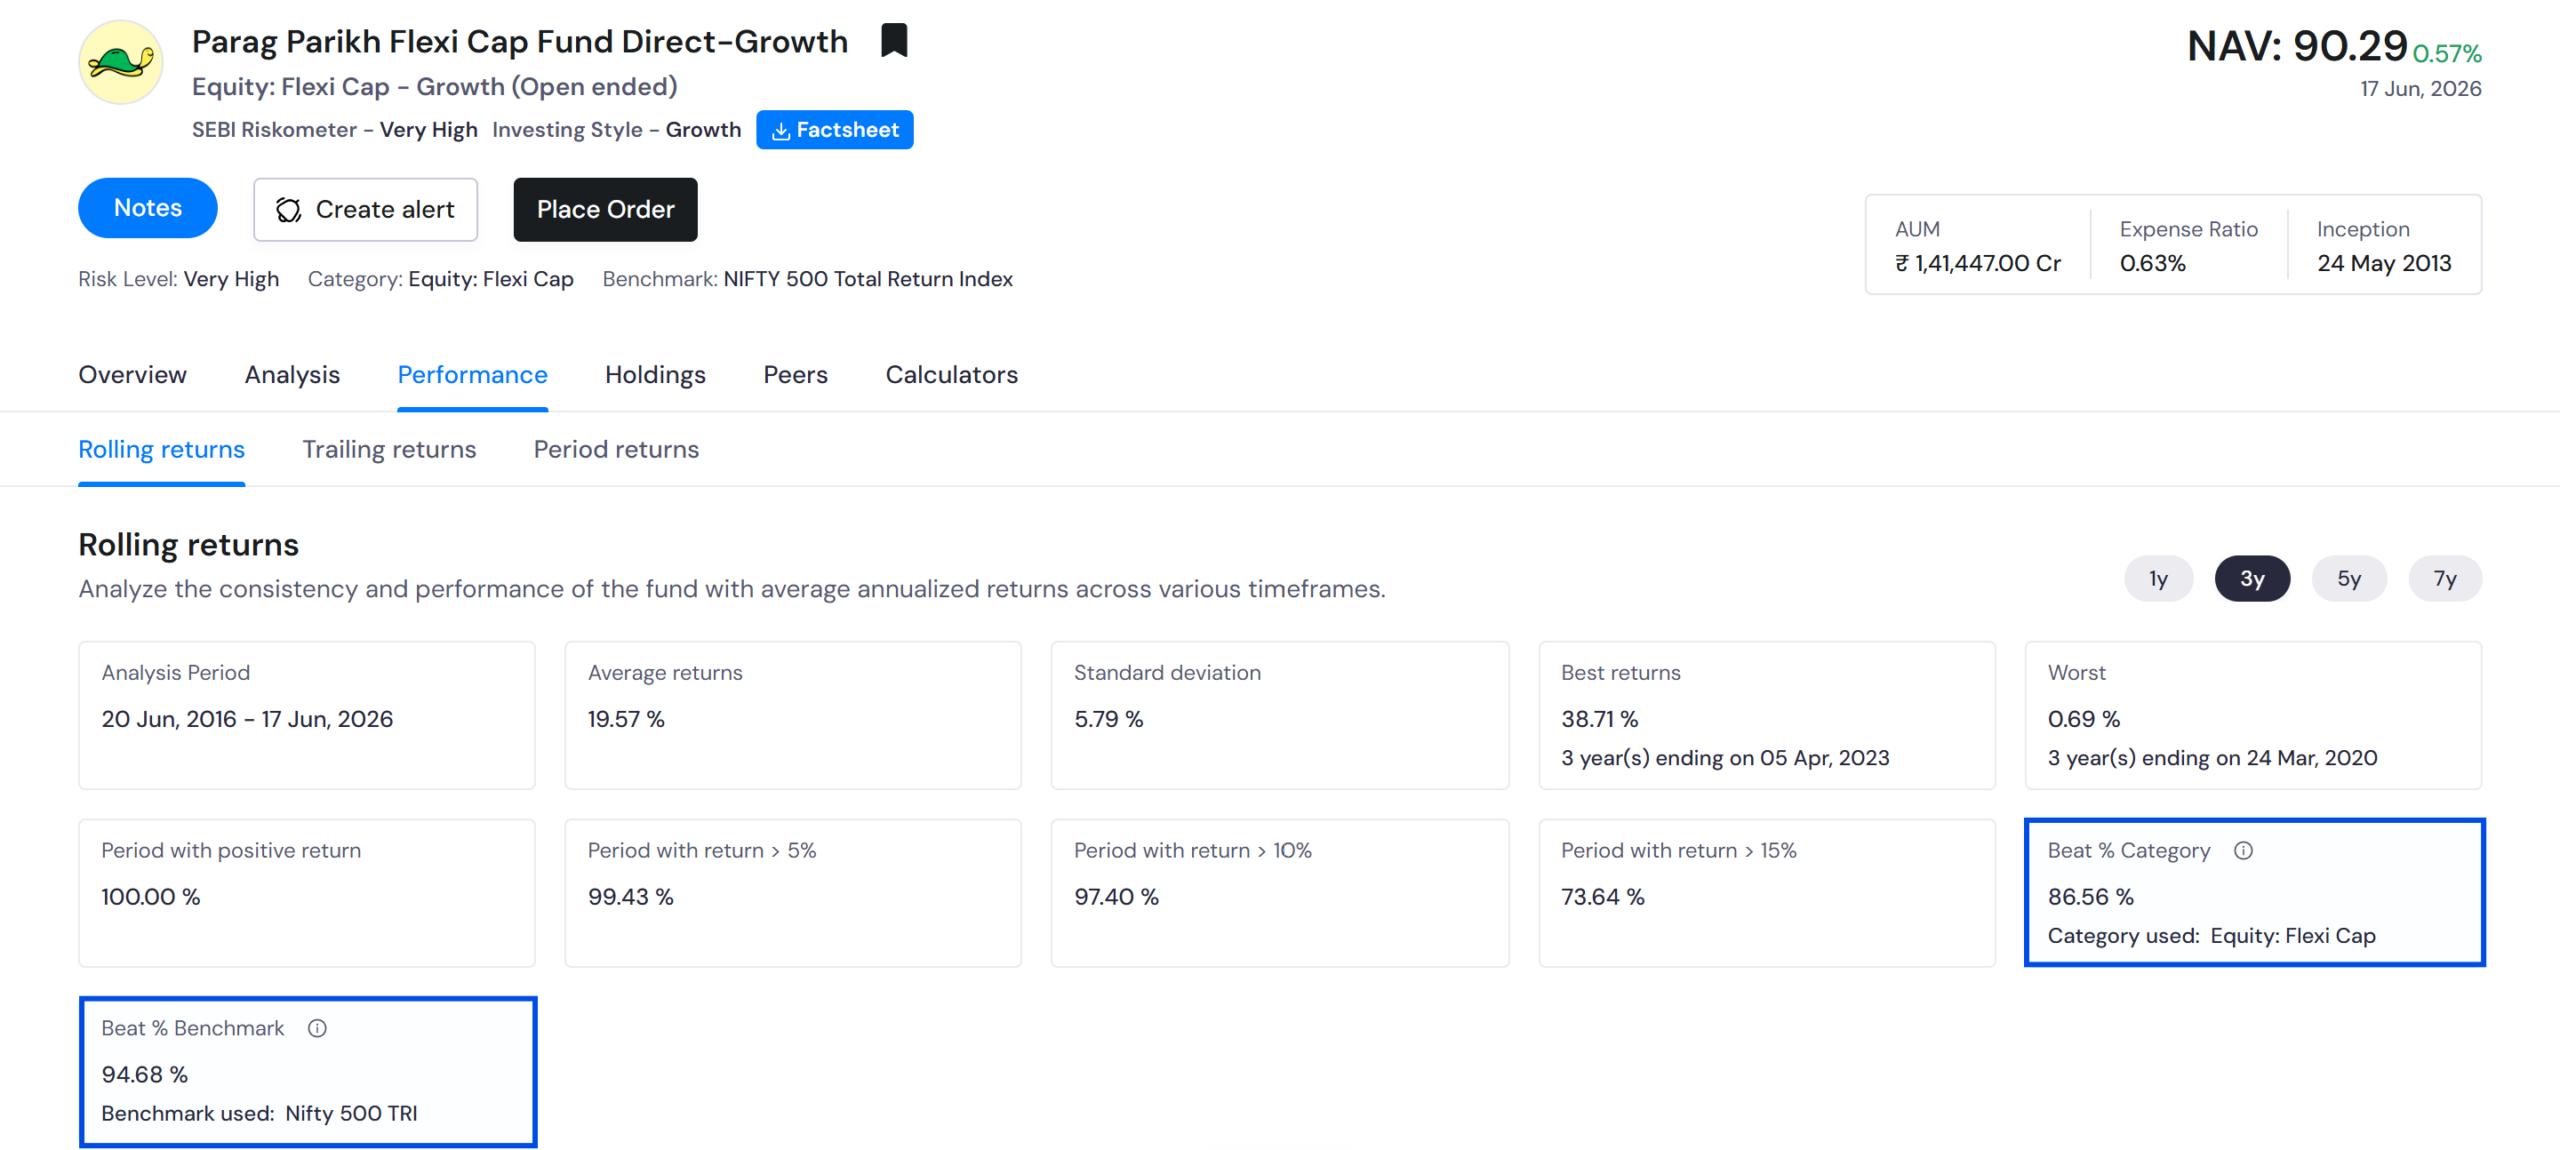
Equity research data on multicap and flexicap categories illustrates this well. Some funds in this space have shown 3-year and 5-year compounded annualised rolling returns meaningfully ahead of their category average and benchmark, a sign of genuine consistency, not a lucky stretch. Other funds with similar or even higher point-to-point CAGR show a much lower rolling-return beat rate against the same category, meaning their average masks long stretches of underperformance. Check the 3-year rolling return analysis of Parag Parikh Flexicap Fund in the image below.
The lesson is not that CAGR is useless; it is a fine starting filter. The lesson is that CAGR alone cannot tell you whether a fund’s performance is repeatable or was a one-time event. Rolling returns can.
Mistake 2: Assuming More Funds Means More Diversification
The second mistake is the more common one. Many investors hold four, five, or even six mutual funds under the belief that more funds automatically means more diversification. In practice, this is often false, and it is called portfolio overlap.
Portfolio overlap is simply the percentage of common stock holdings between two or more funds. If your large-cap fund and your flexi-cap fund both hold significant positions in the same five or six companies, you are not as diversified as the number of funds in your portfolio suggests.
A well-documented and easy-to-verify example: a Nifty 50 index fund and an actively managed large-cap fund draw from almost the exact same universe of stocks: the top 50 to 100 companies by market capitalisation in India. Industry data consistently shows the overlap between a Nifty 50 index fund and an active large-cap fund running at 60% or higher. If you hold both, you are effectively paying two separate expense ratios for what is, in large part, one underlying portfolio.
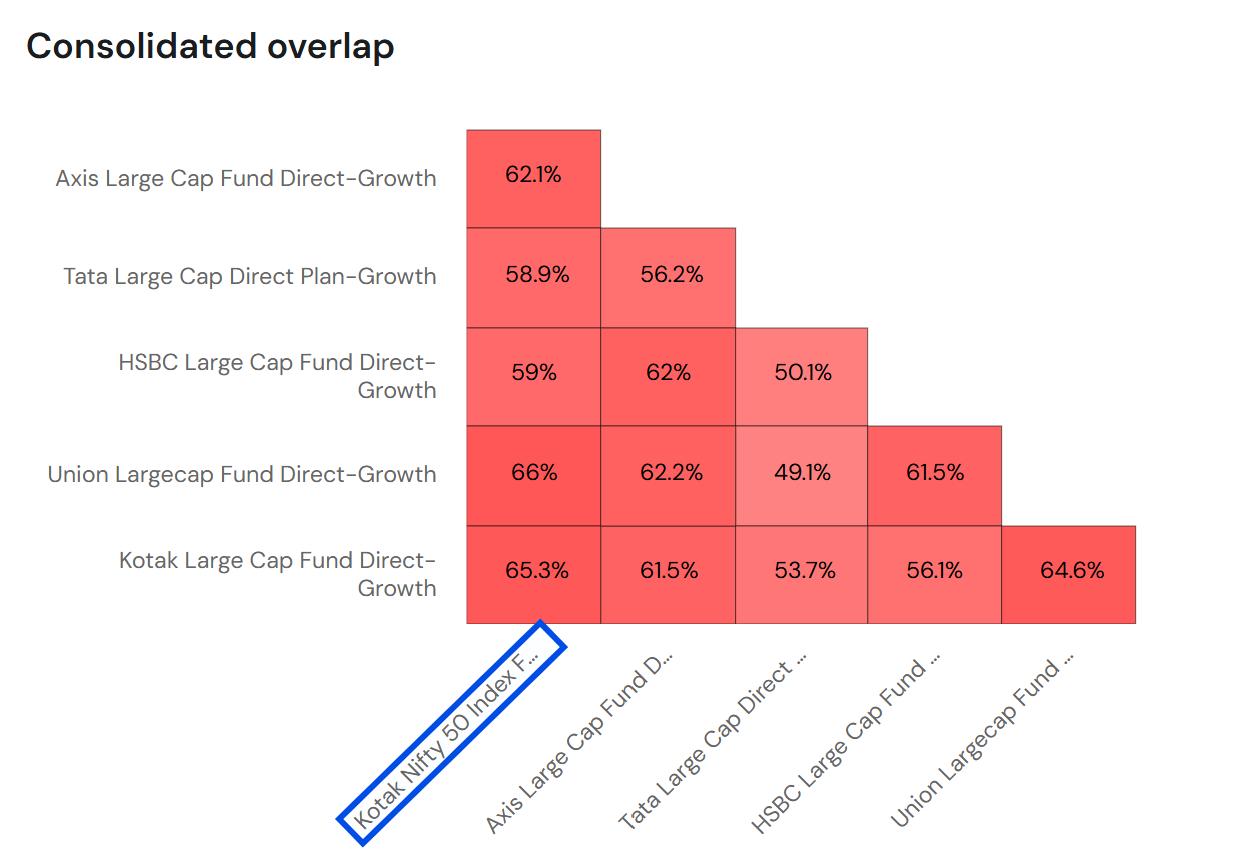
The same pattern shows up across category combinations that millions of Indian investors hold simultaneously — a large-cap fund, a flexi-cap fund, and a multi-cap fund. All three typically draw from a similar pool of large, well-known companies: names like HDFC Bank, Reliance Industries, ICICI Bank, Infosys, and TCS tend to appear as top holdings across all three fund types, simply because they are large enough to qualify for every category’s mandate.
The result, as multiple mutual fund research platforms have documented, is that investors holding what feels like three different funds can end up with 40-60% of their combined equity exposure concentrated in the same four or five stocks. You believe you have spread your risk across three strategies. In reality, you have one concentrated bet wearing three different fund names.
A simple rule of thumb used across the mutual fund research industry:
| Overlap Range | What It Means |
| Below 30% | Healthy. The funds are doing meaningfully different jobs in your portfolio. |
| 30% to 50% | Moderate. Worth reviewing — some duplication, but may still be acceptable depending on each fund’s role. |
| Above 50% | High. The two funds are largely investing in the same stocks. You are likely paying twice for one exposure. |
None of this means overlap is always bad. A Nifty 50 index fund paired with a small-cap fund, for instance, will show very low overlap — because the two are genuinely investing in different parts of the market. The problem arises specifically when investors stack multiple funds from similar categories without realising how similar their underlying holdings actually are.
Why Almost Nobody Checks Either of These
Neither rolling returns nor portfolio overlap requires advanced financial knowledge to understand. The reason most investors never check them is simpler: nothing in their everyday experience of investing surfaces these numbers.
Every fund factsheet, every investment app’s homepage, and most advisor conversations lead with CAGR or absolute returns, because it is the simplest single number to display. Rolling returns require pulling historical NAV data across hundreds of overlapping time windows and comparing it against a category average, not something you can do by glancing at a factsheet PDF.
Portfolio overlap requires comparing the full month-by-month stock holdings of every fund you own, stock by stock, and calculating the common weighted exposure. With most portfolios holding 4-6 funds, doing this manually means cross-referencing dozens of pages of disclosures — not realistic for most people to do on their own, even though SEBI mandates monthly portfolio disclosures from every AMC.
This is not a failure of investor diligence. It is simply that the two numbers that matter most for understanding fund quality and portfolio efficiency are also the two hardest to compute by hand.
How to Check Both for Your Own Portfolio
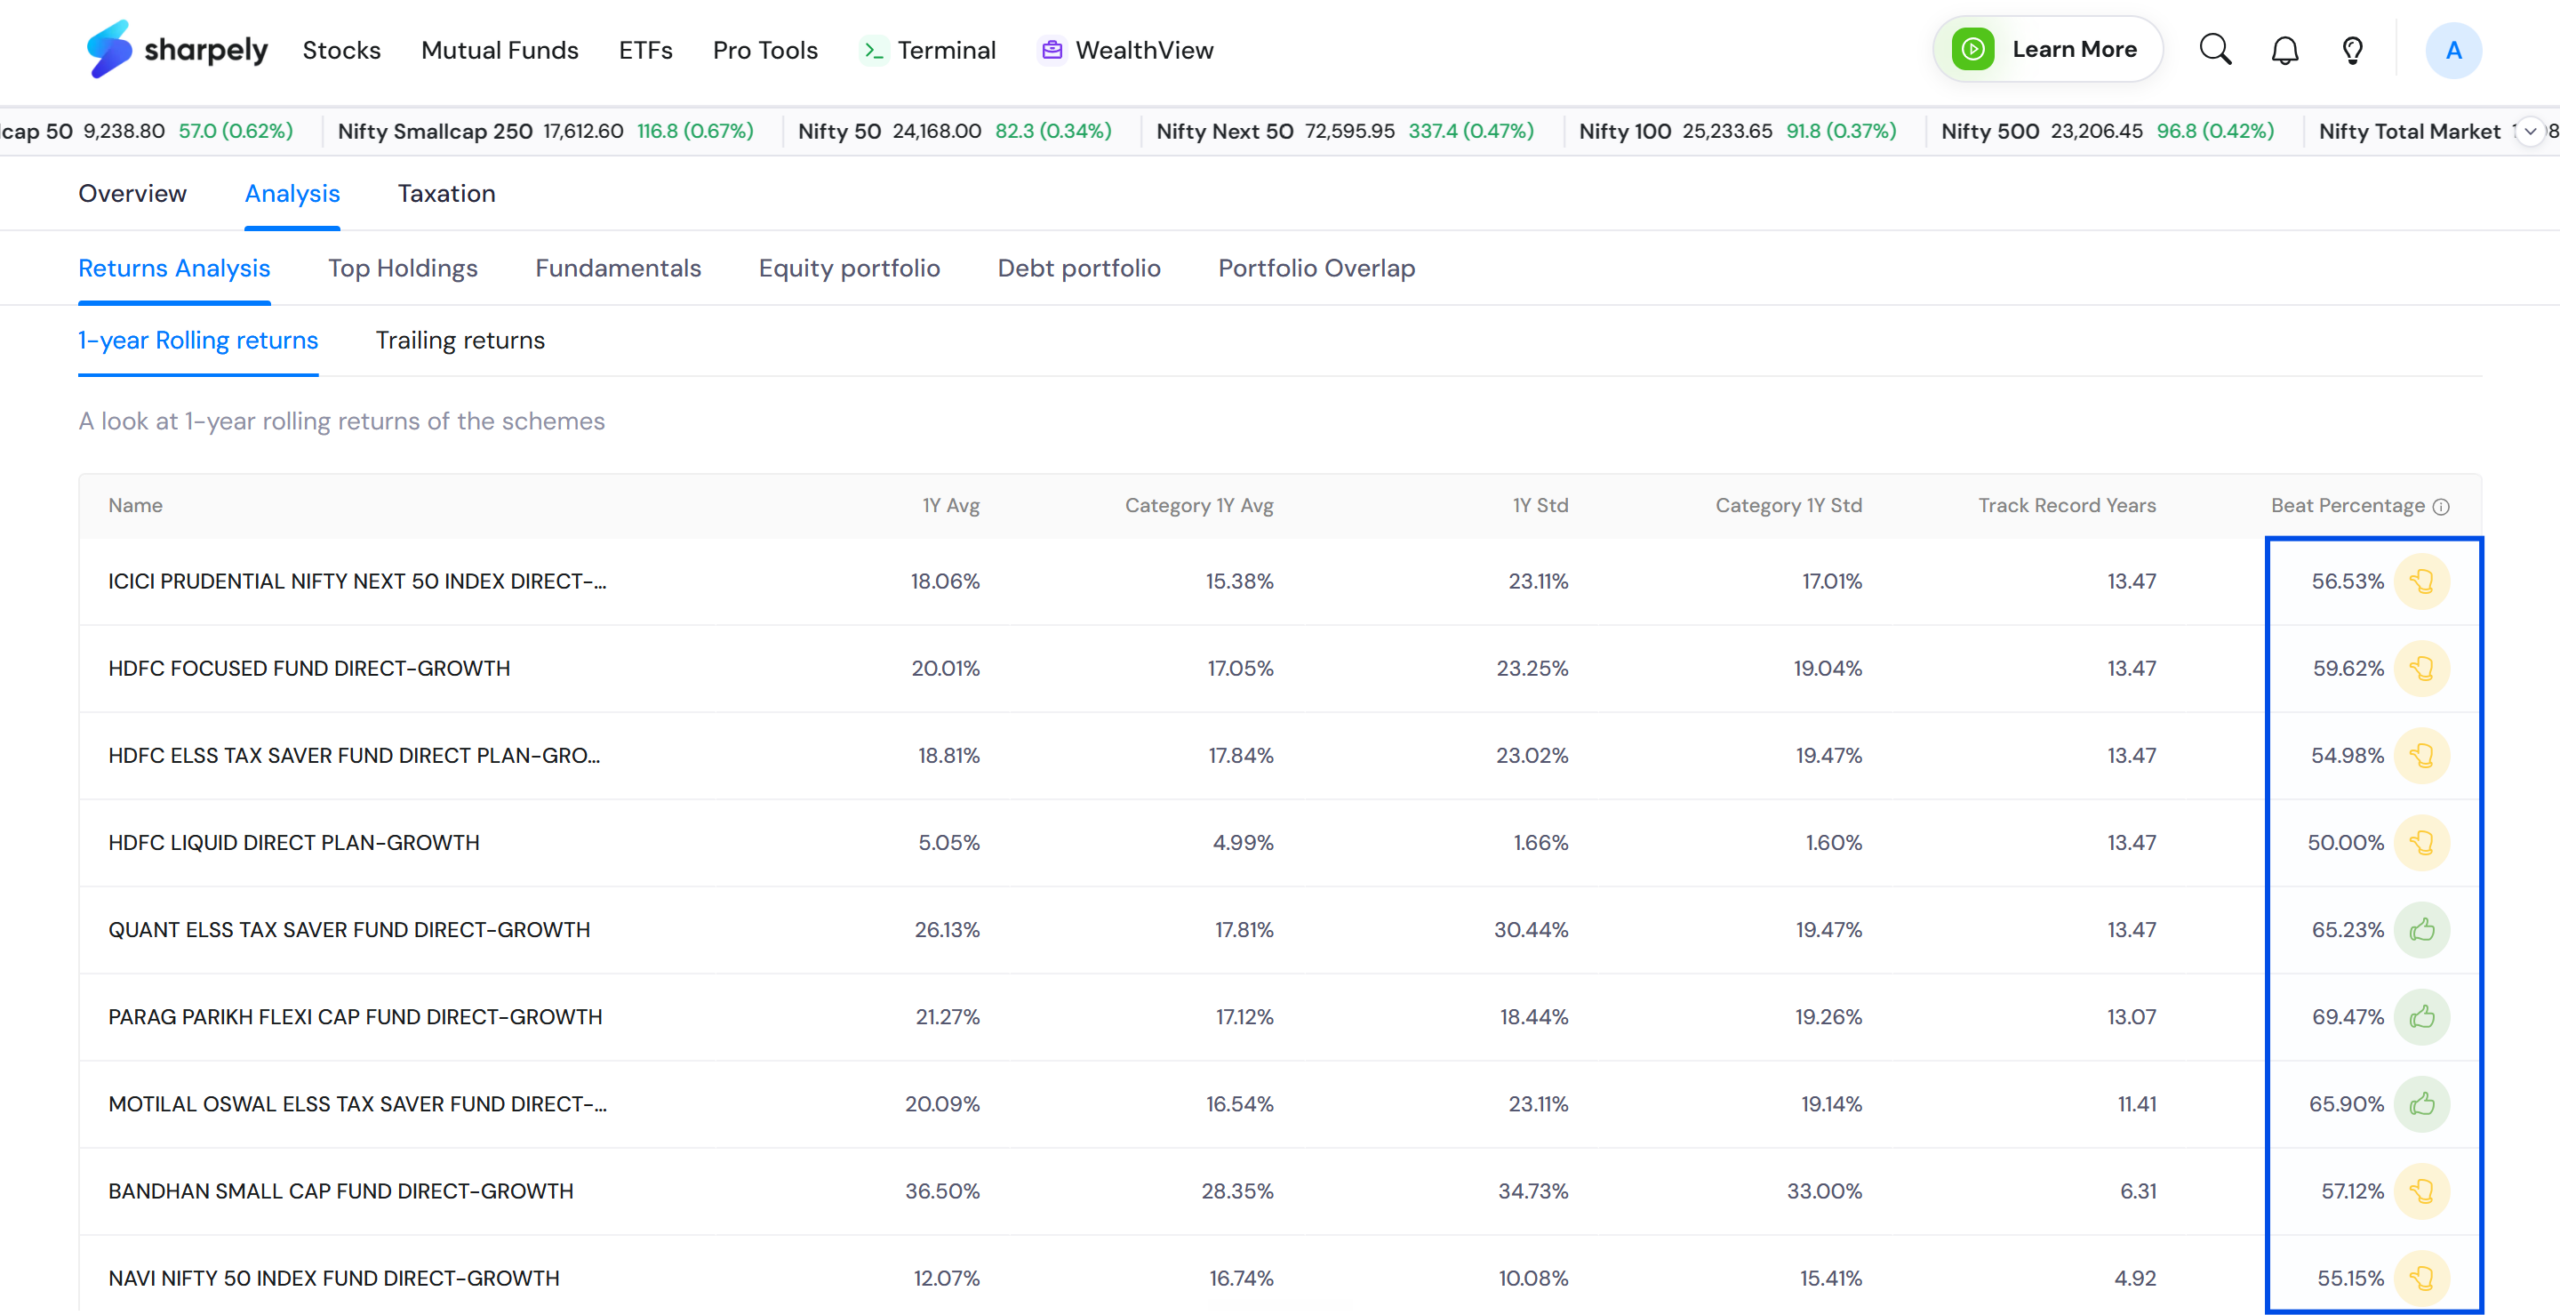
Both checks are now available without any manual calculation. sharpely’s WealthView shows the rolling return beat percentage versus category average for all your MF holdings, letting you see, at a glance, how consistently a fund has actually outperformed its peers across rolling time windows, not just at one fixed point in time. Check the image below.
WealthView also runs a portfolio overlap check across the funds you actually hold — showing you the common stocks and the weighted overlap between any two or more of your funds, so you can see exactly where your portfolio is concentrated versus where it is genuinely diversified. Here is how it looks.
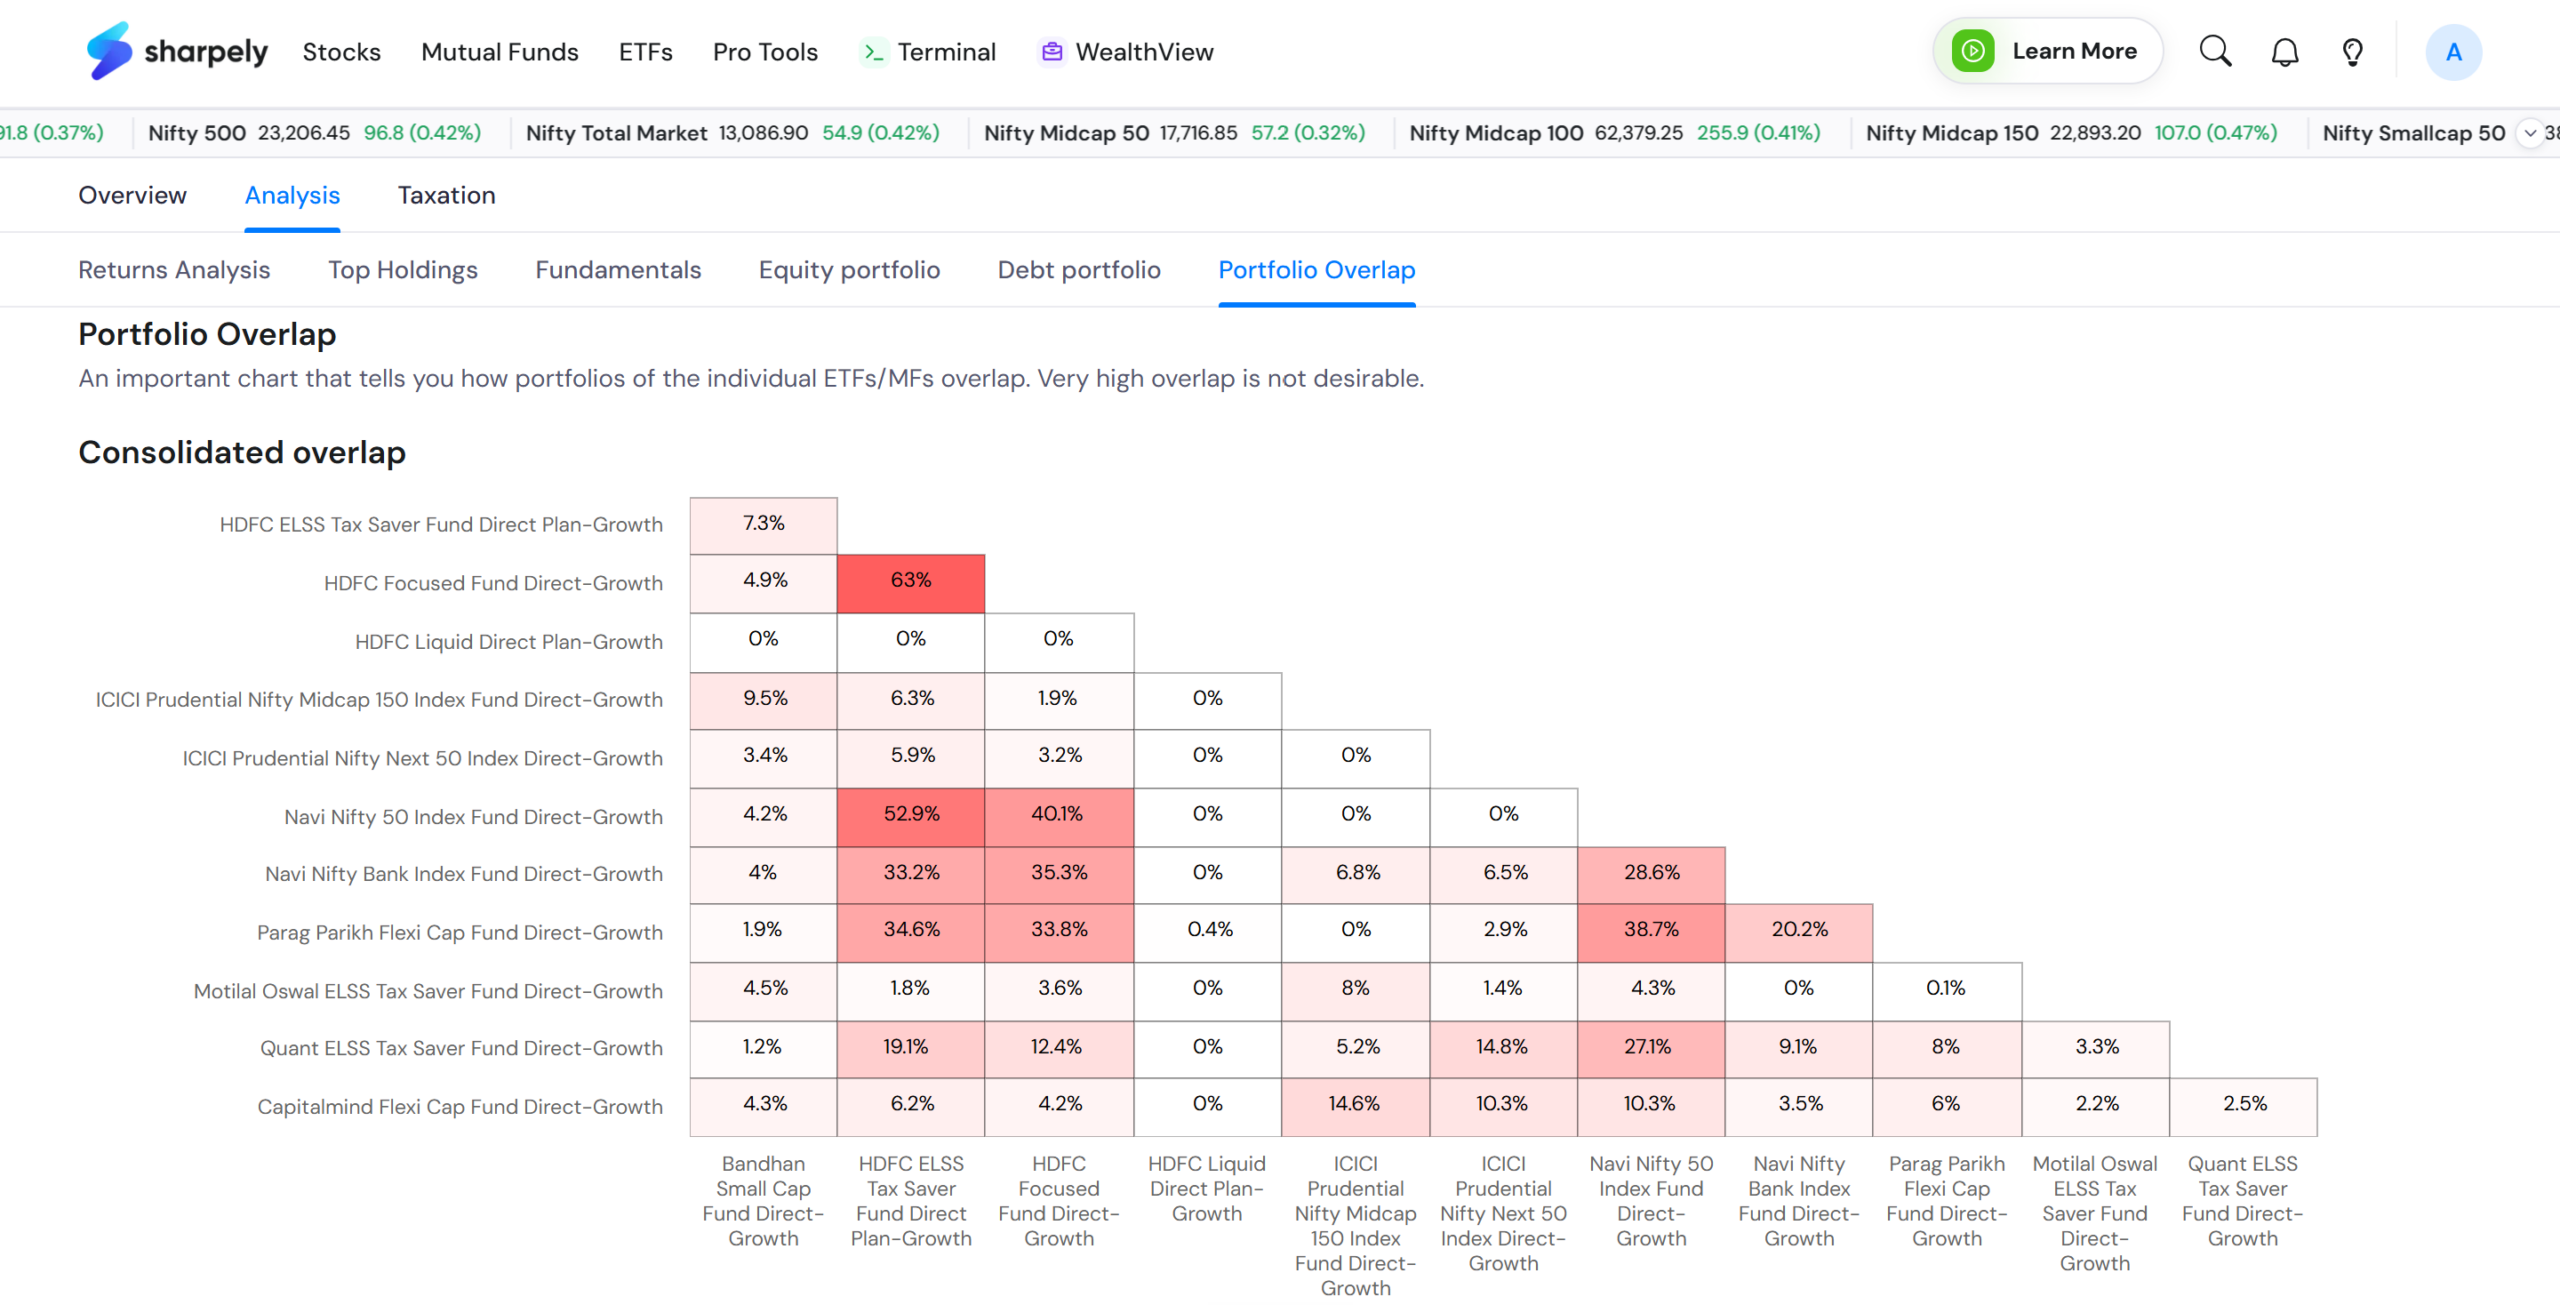
Both features are free to use. If you have never looked at either number for your own holdings, it takes only a few minutes to check both on sharpely WealthView, and it may change how you think about funds you have held for years.
Key Takeaways
CAGR tells you the destination, not the journey. Two funds with identical CAGR can have very different consistency. Rolling return beat percentage versus category reveals which one is the more reliable performer.
More funds do not automatically mean more diversification. Funds from similar categories, like a Nifty 50 index fund and an active large-cap fund, can overlap 60% or more, meaning you are paying multiple expense ratios for largely the same underlying stocks.
Both numbers exist; they are just not surfaced by default. Rolling returns and portfolio overlap require data and computation that most investors cannot do manually, but the data have been publicly available all along.
The fix takes a few minutes. Checking both for your own portfolio on sharpely WealthView for free is the simplest way to find out whether your funds are actually doing what you think they are doing.