
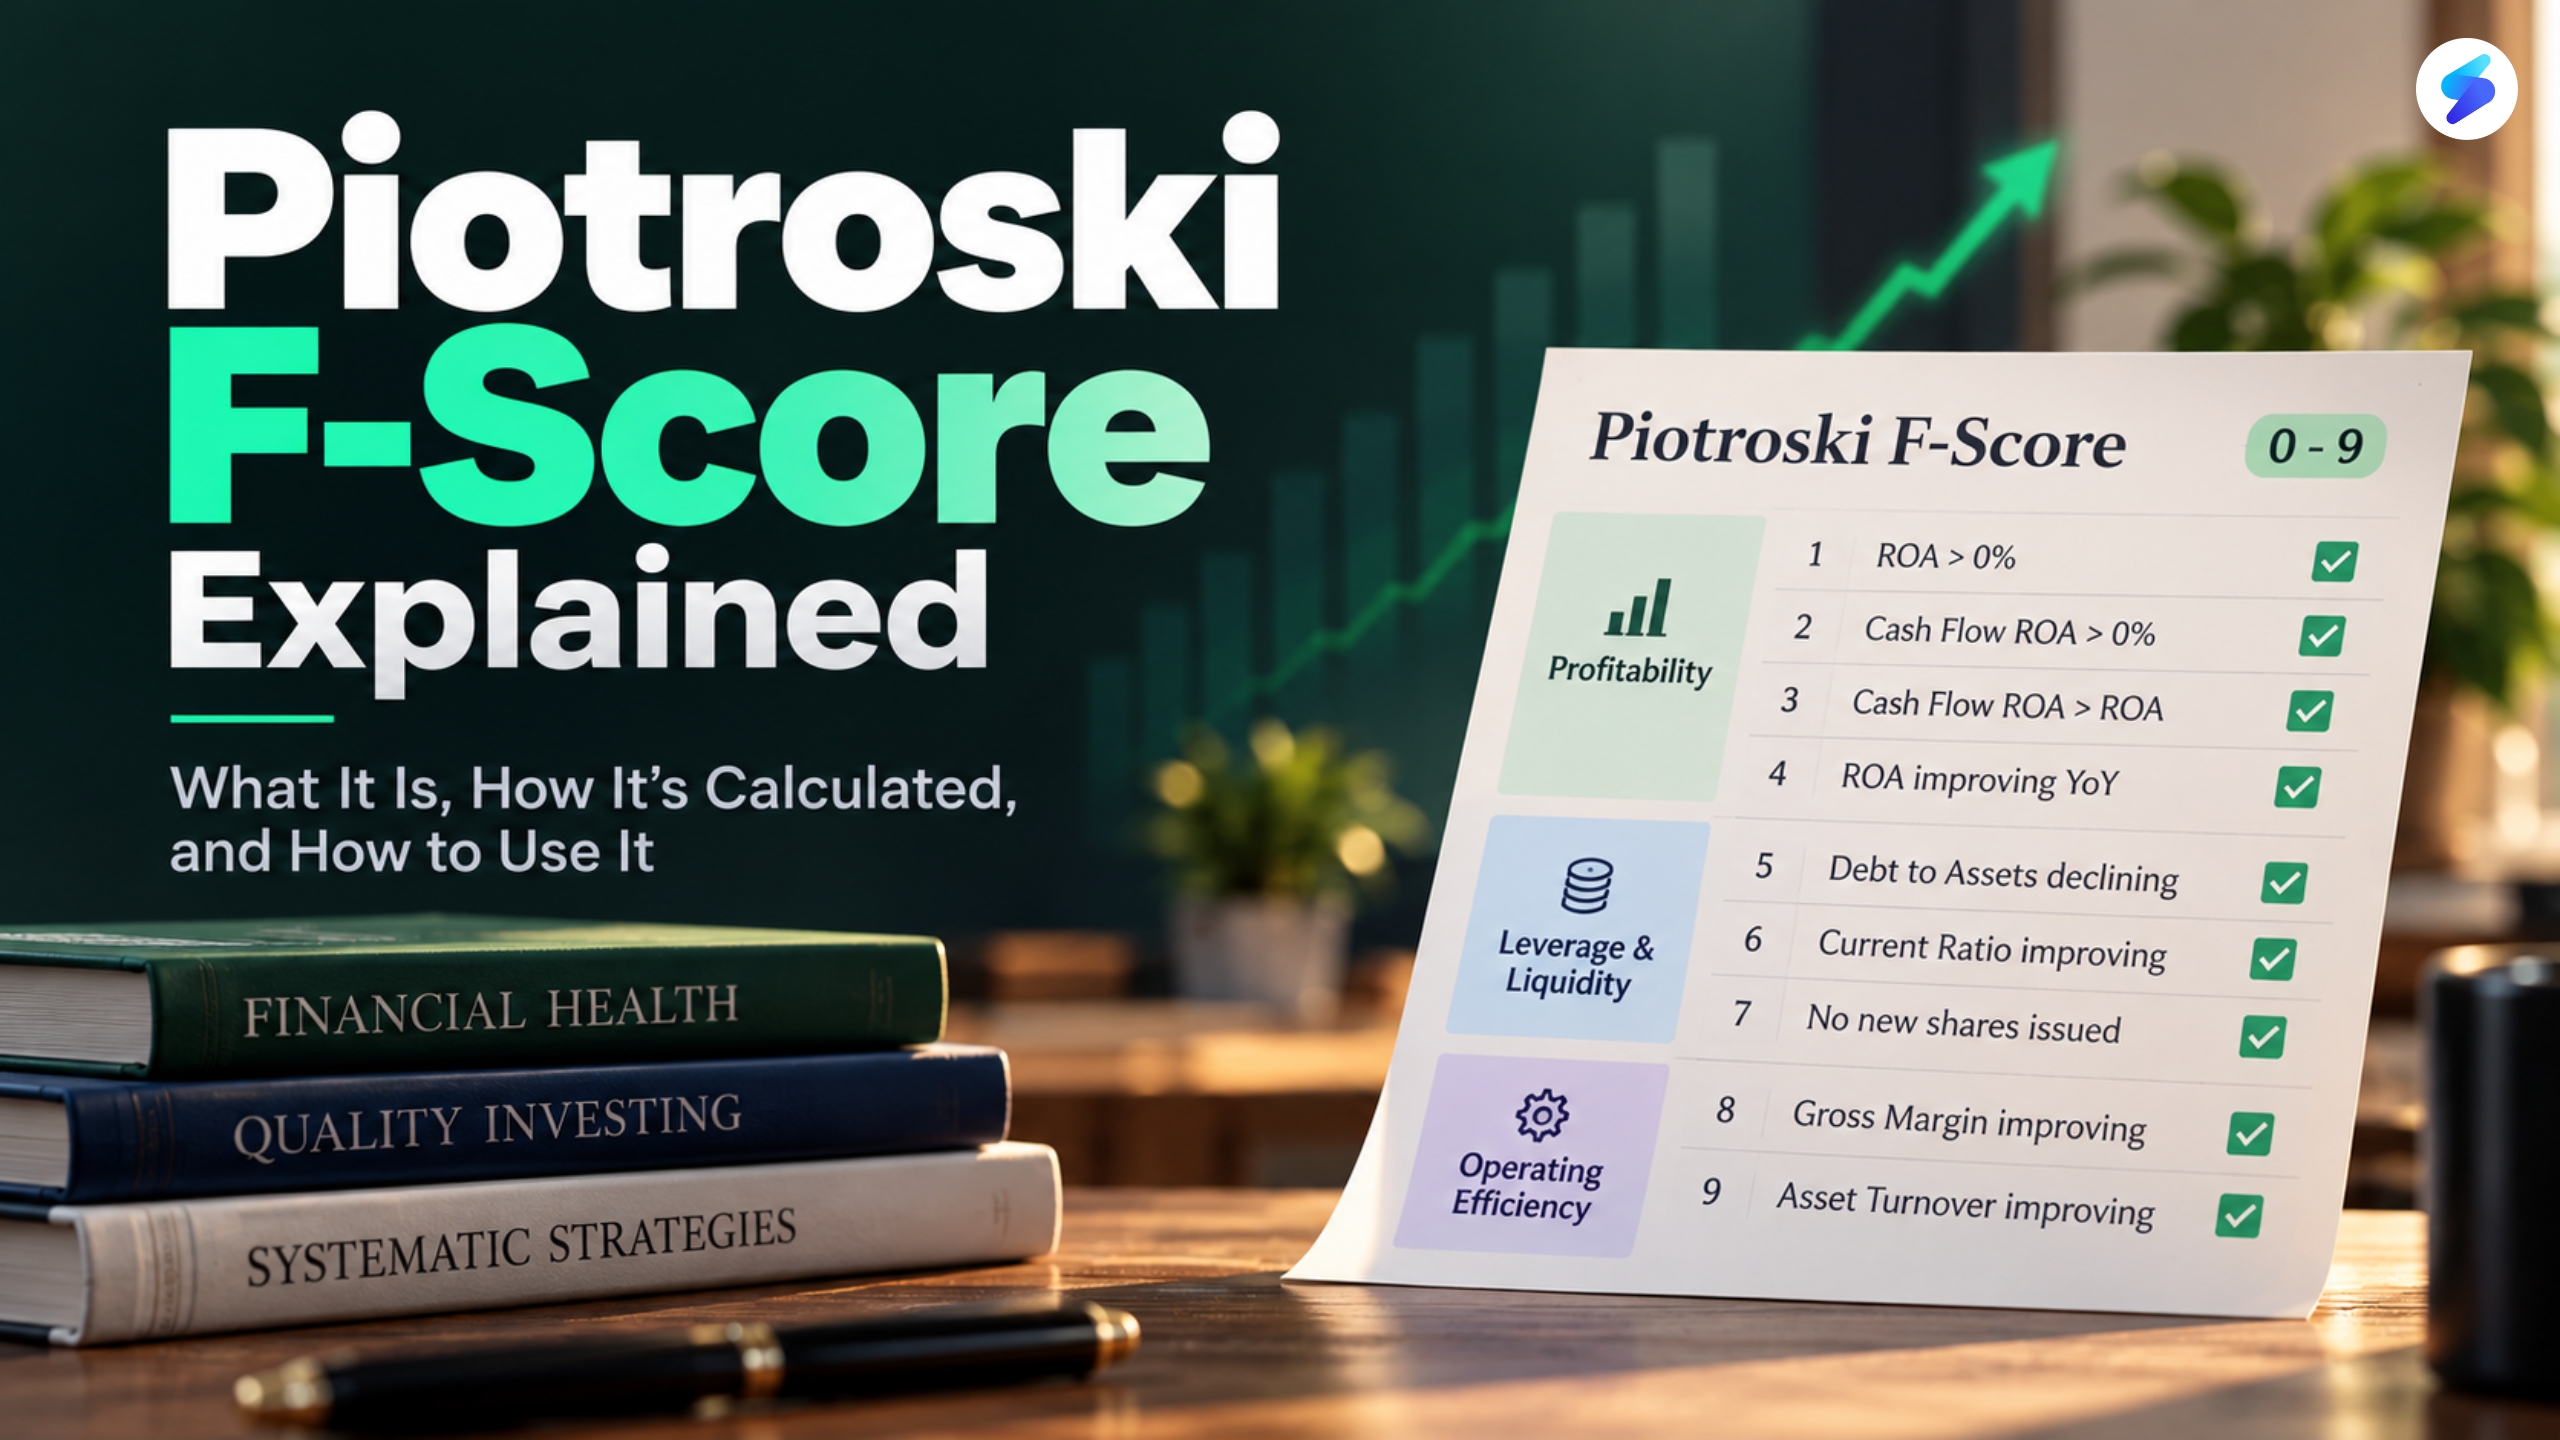
In 2000, accounting professor Joseph Piotroski published a paper that would become one of the most cited works in quantitative investing. His insight was deceptively simple: take a nine-point financial health checklist, apply it to cheap stocks, and buy only those that score highly. No forecasting. No DCF models. No management calls.
The Piotroski F-Score is that checklist. Each of the nine criteria scores either 1 (met) or 0 (not met). The total ranges from 0 to 9. A score of 8 or 9 signals a financially strong, improving business. A score of 0–2 signals deterioration or distress.
More than two decades later, the F-Score remains one of the most widely used systematic screening tools in fundamental investing, because it is transparent, reproducible, grounded in real financial data, and has been validated across global markets including India.
The Nine Criteria: What the F-Score Actually Measures
Piotroski organised the nine criteria across three dimensions: profitability, leverage and liquidity, and operating efficiency. Each is binary, 1 if the condition is met, 0 if not.
Dimension 1: Profitability (4 criteria)
F1 — ROA Piotroski > 0%: Net income divided by total assets must be positive. The company must be profitable at the most basic level — earning more than it spends. On sharpely, this is labelled ‘ROA Piotroski is greater than 0%’.
F2 — Cash Flow ROA > 0%: Cash flow from operations divided by total assets must be positive. A company can report positive net income while generating negative operating cash flow through aggressive working capital management. This criterion, ‘Cash flow ROA is greater than 0%’ on sharpely, ensures profitability is cash-backed, not manufactured.
F3 — Cash Flow ROA > ROA Piotroski (Accrual): Operating cash flow ROA must exceed accounting ROA. In plain terms, the company must generate more cash than it reports as profit. On sharpely this appears as ‘Cash flow ROA is greater than ROA Piotroski’. When cash earnings exceed accounting earnings, it is a high-quality signal. When the reverse holds, it raises concerns about earnings reliability.
F4 — ROA Piotroski improving year-on-year: Return on assets must have improved versus the prior year, ‘ROA Piotroski is greater than ROA Piotroski 12 months ago’. F1 tells you a company is profitable today. F4 tells you it is becoming more profitable — direction matters as much as level.
Dimension 2: Leverage and Liquidity (3 criteria)
F5 — Debt to Assets declining: The debt-to-assets ratio must have decreased versus the prior year, ‘Debt to Assets Latest is less than Debt to Assets Latest 12 months ago’. A company reducing its debt burden relative to its asset base is strengthening its financial resilience.
F6 — Current Ratio improving: The current ratio (current assets divided by current liabilities) must have improved versus the prior year — ‘Current ratio Latest is greater than Current ratio Latest 12 months ago’. A rising current ratio signals improving short-term liquidity.
F7 — No new shares issued: Shares outstanding must not have increased, ‘Shares outstanding Latest is less than Shares outstanding Latest 12 months ago’. Companies that issue equity when financially stressed do so because they cannot service debt or self-fund operations, a dilutive and typically negative signal.
Dimension 3: Operating Efficiency (2 criteria)
F8 — Gross Margin improving: Gross profit margin must have improved versus the prior year, ‘Gross margin TTM is greater than Gross margin TTM 12 months ago’. Rising gross margins indicate pricing power, input cost control, or a better product mix.
F9 — Asset Turnover improving: Revenue divided by total assets must have improved versus the prior year, ‘Asset Turnover Latest is greater than Asset Turnover Latest 12 months ago’. A rising asset turnover means the company is generating more revenue from the same asset base, becoming more operationally efficient.
The Complete F-Score Framework
| # | Condition (as shown on sharpely) | Dimension | What a pass means |
|---|---|---|---|
| F1 | ROA Piotroski > 0% | Profitability | Company is profitable this year |
| F2 | Cash flow ROA > 0% | Profitability | Profits are backed by real cash generation |
| F3 | Cash flow ROA > ROA Piotroski | Profitability | Earnings quality is high — cash exceeds accounting profit |
| F4 | ROA Piotroski > ROA Piotroski 12 months ago | Profitability | Profitability is improving year-on-year |
| F5 | Debt to Assets Latest < Debt to Assets 12 months ago | Leverage/Liquidity | Debt burden is declining year-on-year |
| F6 | Current ratio Latest > Current ratio 12 months ago | Leverage/Liquidity | Short-term liquidity is improving |
| F7 | Shares outstanding Latest < Shares outstanding 12 months ago | Leverage/Liquidity | Company not diluting shareholders |
| F8 | Gross margin TTM > Gross margin TTM 12 months ago | Op. Efficiency | Margins improving, pricing power or cost control |
| F9 | Asset Turnover Latest > Asset Turnover 12 months ago | Op. Efficiency | Same asset base generating more revenue |
How to Interpret the Score
The raw F-Score runs from 0 to 9.
On sharpely, when you inspect an individual stock through the Guru Checklist (as shown in the image below), this is normalised to a 0–100 gauge (each of the 9 criteria = 11.1 points). When you use the Super Screener to filter stocks, you work with the raw number directly — for example, F-Score > 7. The underlying score is identical; only the display format differs.
Score 8–9 / 89–100 (Strong): The company is financially healthy and improving across almost all dimensions. Profitability is cash-backed, leverage is declining, liquidity is strengthening, and operational efficiency is rising. In the Indian context, a score above 7 (above 78 on the gauge) is the standard high-quality filter threshold.
Score 4–7 / 44–78 (Neutral): A mixed picture — some criteria met, others not. No clear directional signal. These companies require deeper analysis to understand whether the failing criteria are temporary or structural.
Score 0–3 / 0–33 (Weak): Signs of financial deterioration across multiple dimensions. Piotroski’s original research showed that low-scoring stocks significantly underperformed — making the F-Score useful not just for identifying what to buy, but equally for identifying what to avoid.
One important nuance: Piotroski designed the F-Score specifically to discriminate within the value universe, to separate financially strong cheap stocks from financially weak cheap stocks. It works best as a quality filter applied to stocks that are already optically cheap on valuation metrics, rather than as a standalone signal applied to the broad market.
Check Any Stock’s F-Score Instantly on sharpely
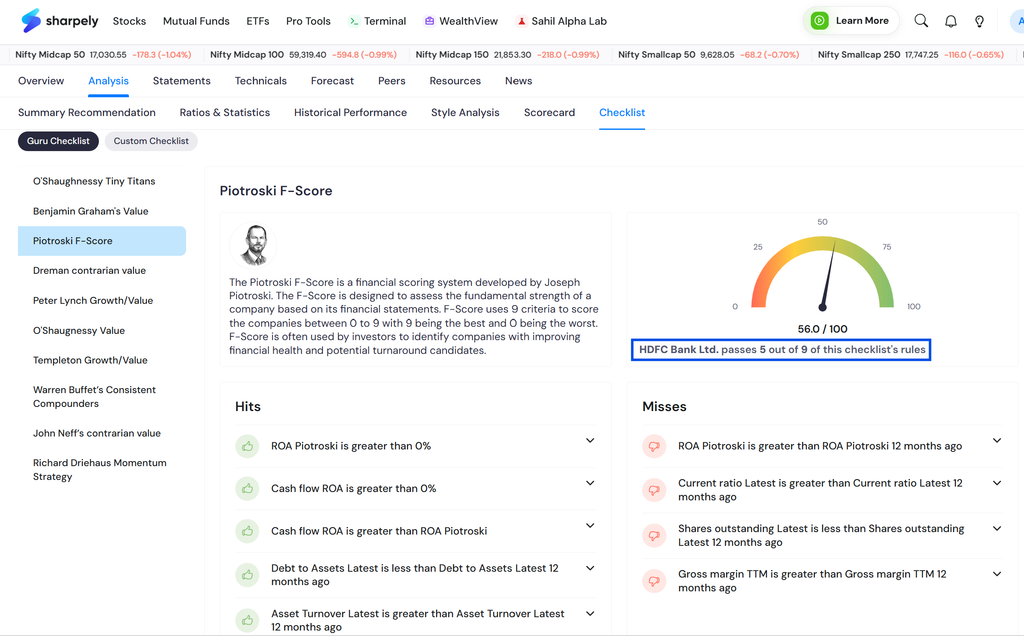
Before building a screen or running a strategy, it is useful to understand what the F-Score looks like for a specific stock you already follow. sharpely makes this instant through the Guru Checklist, a feature inside the Analysis tab of every stock page.
Navigate to any stock, go to Analysis → Checklist, and select Piotroski F-Score from the left panel. What you see is a real-time breakdown of all nine criteria, split into two clear groups:
Hits (green thumbs up) — criteria the stock currently passes. For HDFC Bank in the example above: ROA Piotroski is greater than 0%, Cash flow ROA is greater than 0%, Cash flow ROA is greater than ROA Piotroski, Debt to Assets is declining, and Asset Turnover is improving.
Misses (red thumbs down) — criteria the stock fails. For HDFC Bank: ROA Piotroski has not improved year-on-year, Current ratio has not improved, new shares have been issued, and Gross margin has declined. Each miss is expandable — clicking it shows the underlying numbers so you can see exactly how close or far off the stock is from meeting the condition.
The gauge at the top right displays the score on a 0–100 scale — sharpely’s Guru Checklist normalises the raw 0–9 score proportionally (each criterion passed = 11.1 points, so 5 of 9 = 56/100). The label beneath confirms the raw count: ‘HDFC Bank Ltd. passes 5 out of 9 of this checklist’s rules.’ This is the same score — just expressed differently. When you use the Super Screener to filter stocks, you work with the raw 0–9 number (F-Score > 7). When you inspect an individual stock’s Checklist, you see the equivalent on the 0–100 gauge.
Why This Matters for Due Diligence
The Checklist view is particularly useful in two situations. First, when a stock exits your screen — instead of just knowing it no longer qualifies, you can see which specific criteria it failed. A single miss on gross margin is very different from misses on cash flow, debt, and equity issuance combined.
Second, when you are evaluating a stock that scores 7 (one below your screen threshold) — the Checklist lets you see whether it narrowly missed on a borderline criterion or broadly failed across multiple dimensions. The raw number alone does not tell you this; the criterion-by-criterion breakdown does.
The Piotroski F-Score Guru Checklist sits alongside eight other investment frameworks in sharpely’s Checklist library — including Benjamin Graham’s Value, Peter Lynch Growth/Value, Warren Buffett’s Consistent Compounders, and Richard Driehaus Momentum Strategy. Each follows the same Hits/Misses format, making it easy to evaluate a stock across multiple frameworks at once.
Building a Piotroski Screen on sharpely
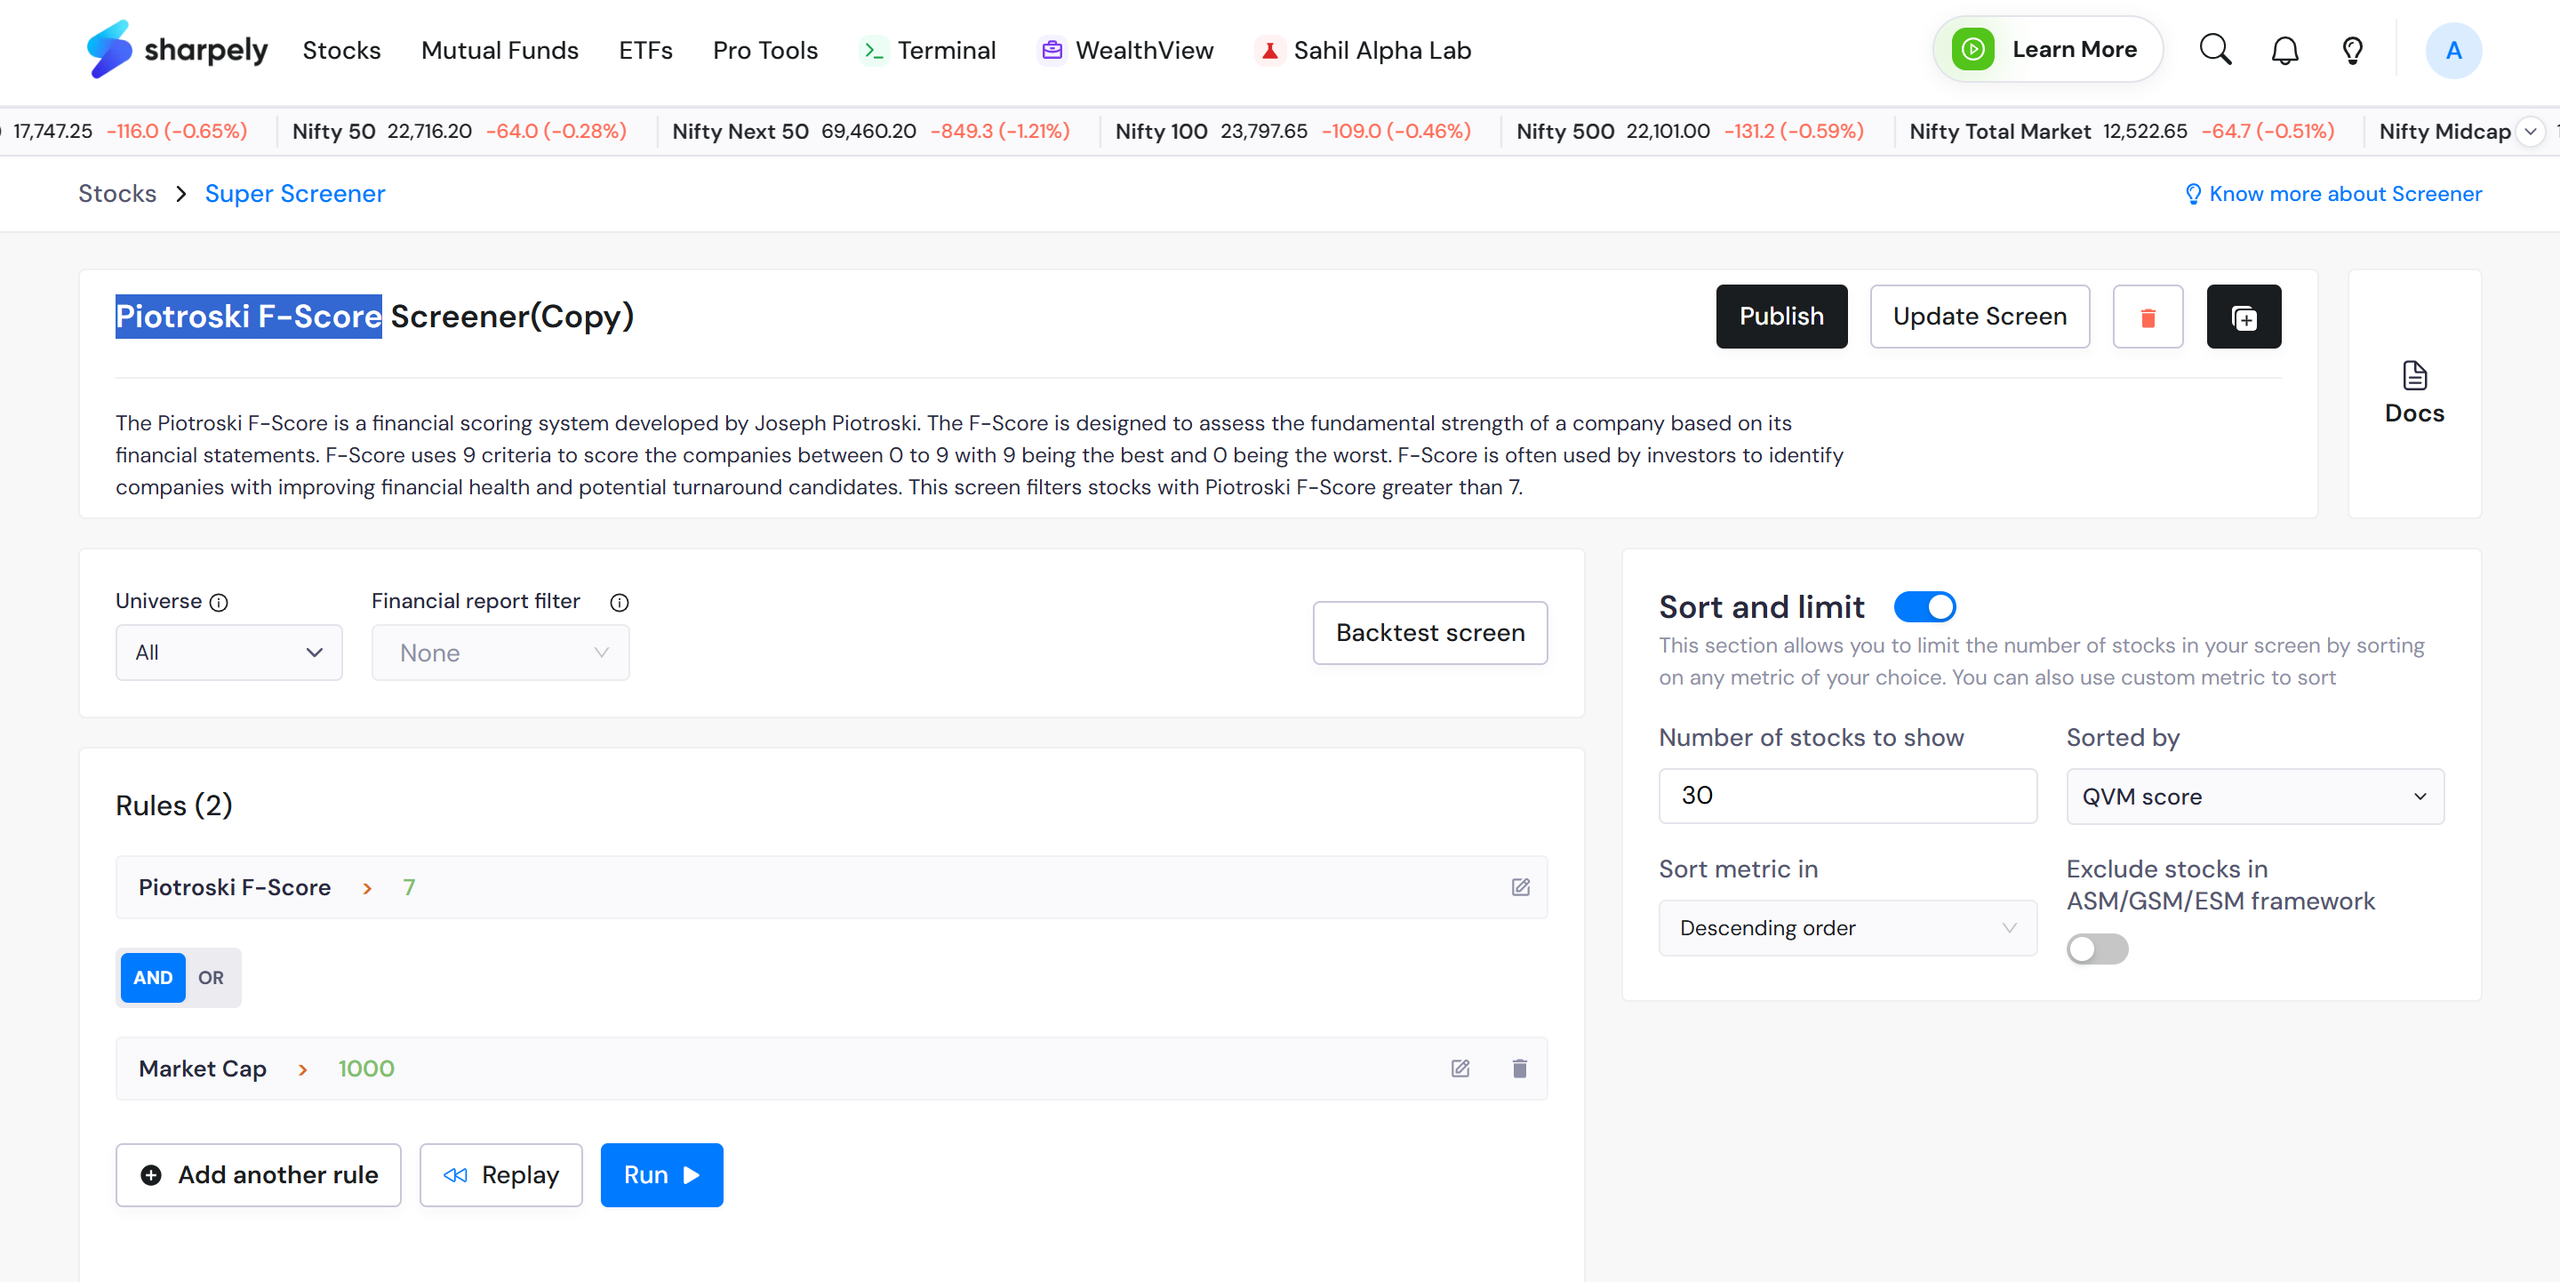
On sharpely’s Super Screener, the Piotroski F-Score is available as a direct screening parameter, you do not need to manually calculate all nine criteria. The screen above uses two conditions:
Condition 1: Piotroski F-Score > 7 — filters only stocks scoring 8 or 9, the zone Piotroski identified as financially strong. Applied to the full NSE universe, this alone can return 80–120 stocks on any given date.
Condition 2: Market Cap > ₹1,000 Cr — a liquidity filter to exclude small and micro-caps where the F-Score signal is harder to act on due to thin trading volumes and wider spreads.
The Sort and Limit setting then narrows the output further: from the stocks passing both conditions, the screen selects the top 30 by QVM score in descending order. This is where the screen becomes substantially more powerful than a simple F-Score filter.
Why Sort by QVM Score?
The Piotroski F-Score is a financial health filter; it tells you whether a company’s fundamentals are sound and improving. What it does not tell you is whether the market has noticed. Two stocks can both score 8 on the F-Score but have very different momentum profiles — one may be in a strong price uptrend with improving earnings estimates, while the other may be ignored or in decline.
The QVM score, a composite of Quality, Value, and Momentum, adds that market and momentum layer on top of the fundamental quality filter. By sorting F-Score-qualified stocks by QVM score, the screen surfaces stocks that are:
Financially strong (F-Score > 7) + multi-factor high scorers (top QVM). The intersection is a focused set of companies with both fundamental and market-based confirmation — the kind of convergence that forms the basis of a robust systematic selection process.
What the Historical Data Shows: 8 Years of Evidence
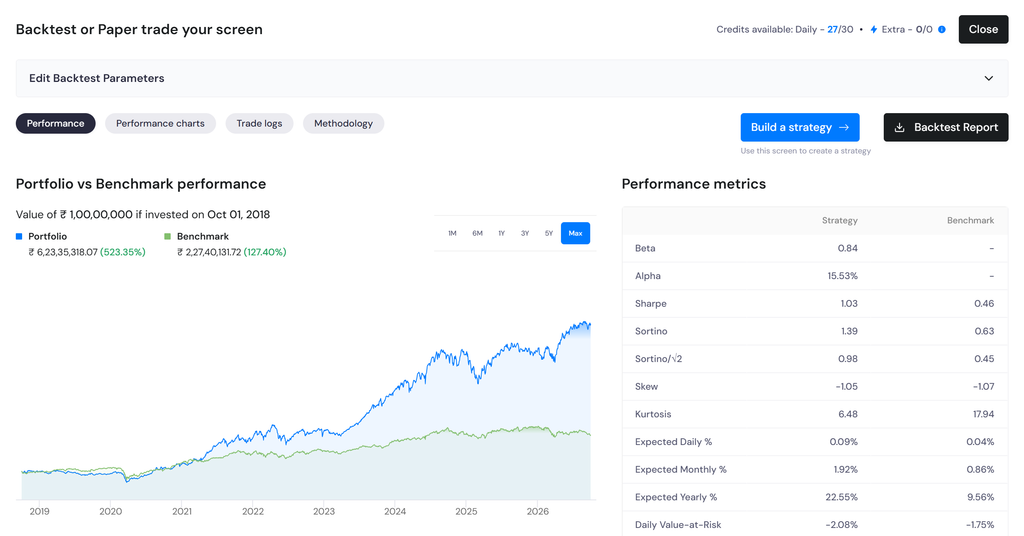
The backtest runs from October 1, 2018 to September 2026, approximately eight years, spanning multiple market regimes: the pre-COVID bull run, the March 2020 crash and recovery, the 2021–22 mid-cap correction, the geopolitical shock of H1 2026, and the subsequent recovery.
| Metric | Strategy | Benchmark | Interpretation |
|---|---|---|---|
| Total Return | +523% | +127% | ₹1 Cr grew to ₹6.23 Cr vs ₹2.27 Cr for the index |
| Alpha | 15.53% | — | Annual excess return above what market exposure alone would predict |
| Beta | 0.84 | — | Lower market sensitivity than the index — less reactive to broad moves |
| Sharpe Ratio | 1.03 | 0.46 | Strategy generated 2.2x more return per unit of total risk |
| Sortino Ratio | 1.39 | 0.63 | Downside risk-adjusted return significantly better than benchmark |
| Win Rate (trades) | 60.54% | — | 359 of 593 trades were profitable |
| Avg Win / Avg Loss | 17.87% / –4.49% | — | Winners are nearly 4x larger than losers — strong profit factor |
Several aspects of this backtest deserve attention beyond the headline return:
Beta of 0.84 with 4x the benchmark return: This is the most revealing number. The strategy delivered +523% while absorbing less market risk than the index. A Beta below 1 means the strategy moves less with the overall market. Higher return, lower market sensitivity — a combination that points to genuine alpha rather than leveraged market exposure. This is the F-Score quality filter at work: financially healthy, cash-generative businesses with declining leverage tend to be structurally more resilient through market stress.
Win rate of 60.54% with an asymmetric payoff: Average winning trade of 17.87% versus average losing trade of –4.49% produces a profit factor of approximately 4:1. This means the strategy can be right on only 40% of trades and still make money. The quality filter is doing its job — limiting the damage on losing positions while allowing winners to run.
Consistent calendar year outperformance: The strategy beat the benchmark in every available calendar year — including 2026, when the benchmark was down –1.83% and the strategy returned +23.65%. Outperforming in a down market is the most rigorous test of whether a quality filter adds real value or simply benefits from bull market conditions.
The profit asymmetry across market regimes: In 2024 and 2025, when the benchmark delivered 16.24% and 7.76% respectively, the strategy returned 31.06% and 30.45% — roughly doubling the benchmark in both years. This consistent multiplier across different market environments suggests the outperformance is not regime-specific luck.
As with all backtests, these results are historical and do not guarantee future performance. Transaction costs (₹1,32,728 across 593 trades) are included in the returns shown. The methodology tab in sharpely’s backtest report details the exact rebalancing assumptions used.
From Screen to Strategy
A screen tells you what qualifies today. A strategy defines what you buy, when you rebalance, when you exit, and how you size positions, consistently and automatically across every cycle.
On sharpely, the Piotroski F-Score screen converts directly into a systematic strategy using the Build a Strategy button. The screen’s conditions become the strategy’s entry criteria — on each rebalancing date, the strategy automatically identifies which stocks pass F-Score > 7 and Market Cap > ₹1,000 Cr, selects the top 30 by QVM score, and generates the order list to align the portfolio with those results.
Practical Parameters to Consider
Rebalancing frequency: The F-Score is based on annual financial data, updated as companies file quarterly results. But as we are filtering using the QVM score, which includes momentum, we have used monthly rebalancing data.
Exit conditions: The natural exit is when a stock no longer qualifies, its F-Score drops below 8, market cap falls below ₹1,000 Cr, or it is no longer in the top 30 by QVM at the next rebalancing date. A trailing stop-loss can be added to exit positions that fall significantly from their entry price before the next scheduled rebalance.
Position sizing: With 30 stocks, equal weighting at approximately 3.3% per position prevents any single name from disproportionately affecting the portfolio while maintaining meaningful exposure to each selected stock.
Limitations to Understand Before Using This Screen
The F-Score is backward-looking: All nine criteria are calculated from the most recently filed financial statements. Between annual filings, certain criteria may not update. Use sharpely’s Financial Report Filter to ensure conditions are evaluated against the most recently filed quarterly data.
It does not incorporate valuation: A company can score 9 on the F-Score and still be significantly overvalued. Piotroski’s original paper applied the score specifically to value stocks. The QVM sort in this screen partially addresses this through the Value component, but investors should verify valuation independently.
It can miss cyclical recoveries: A company at the trough of a sector cycle may score low on F-Score metrics precisely because it is at the low, which is sometimes the best entry point. The F-Score favours companies with steadily improving metrics over those bouncing from a bottom.
Quarterly rotation requires execution discipline: The strategy generates a new order list every quarter. An investor who is emotionally attached to specific holdings will struggle to rotate out when a stock exits the screen — even a strong recent performer. The discipline to execute the rebalancing consistently is as important as the criteria themselves.
Key Takeaways
The Piotroski F-Score is a nine-point fundamental health checklist, not a price-based indicator. It assesses profitability, leverage and liquidity, and operating efficiency, each criterion binary, each contributing equally to the total score.
It works best as a quality filter within the value universe. Piotroski’s original research showed high F-Score value stocks significantly outperformed low F-Score value stocks. Combined with a momentum or multi-factor sort — like the QVM overlay used here, the screen becomes considerably more powerful.
The combination with QVM scoring is the key design choice. F-Score > 7 sets a fundamental quality floor. Sorting by QVM identifies which of those quality stocks the market is currently recognising and rewarding. The result is a small, focused portfolio with both fundamental and market-based confirmation.
The 8-year backtest produced strong risk-adjusted results. +523% vs +127% benchmark, with Beta of 0.84, Sharpe of 1.03, and Alpha of 15.53% annually. Lower market sensitivity alongside higher absolute return is the signature of genuine quality-driven alpha. Past performance does not guarantee future results.
A screen becomes a strategy when you add rebalancing rules, exit conditions, and position sizing. sharpely’s Strategy Builder converts this screen directly into a deployable systematic strategy, generating order lists on each rebalancing date without requiring you to manually re-run the filter each quarter.