
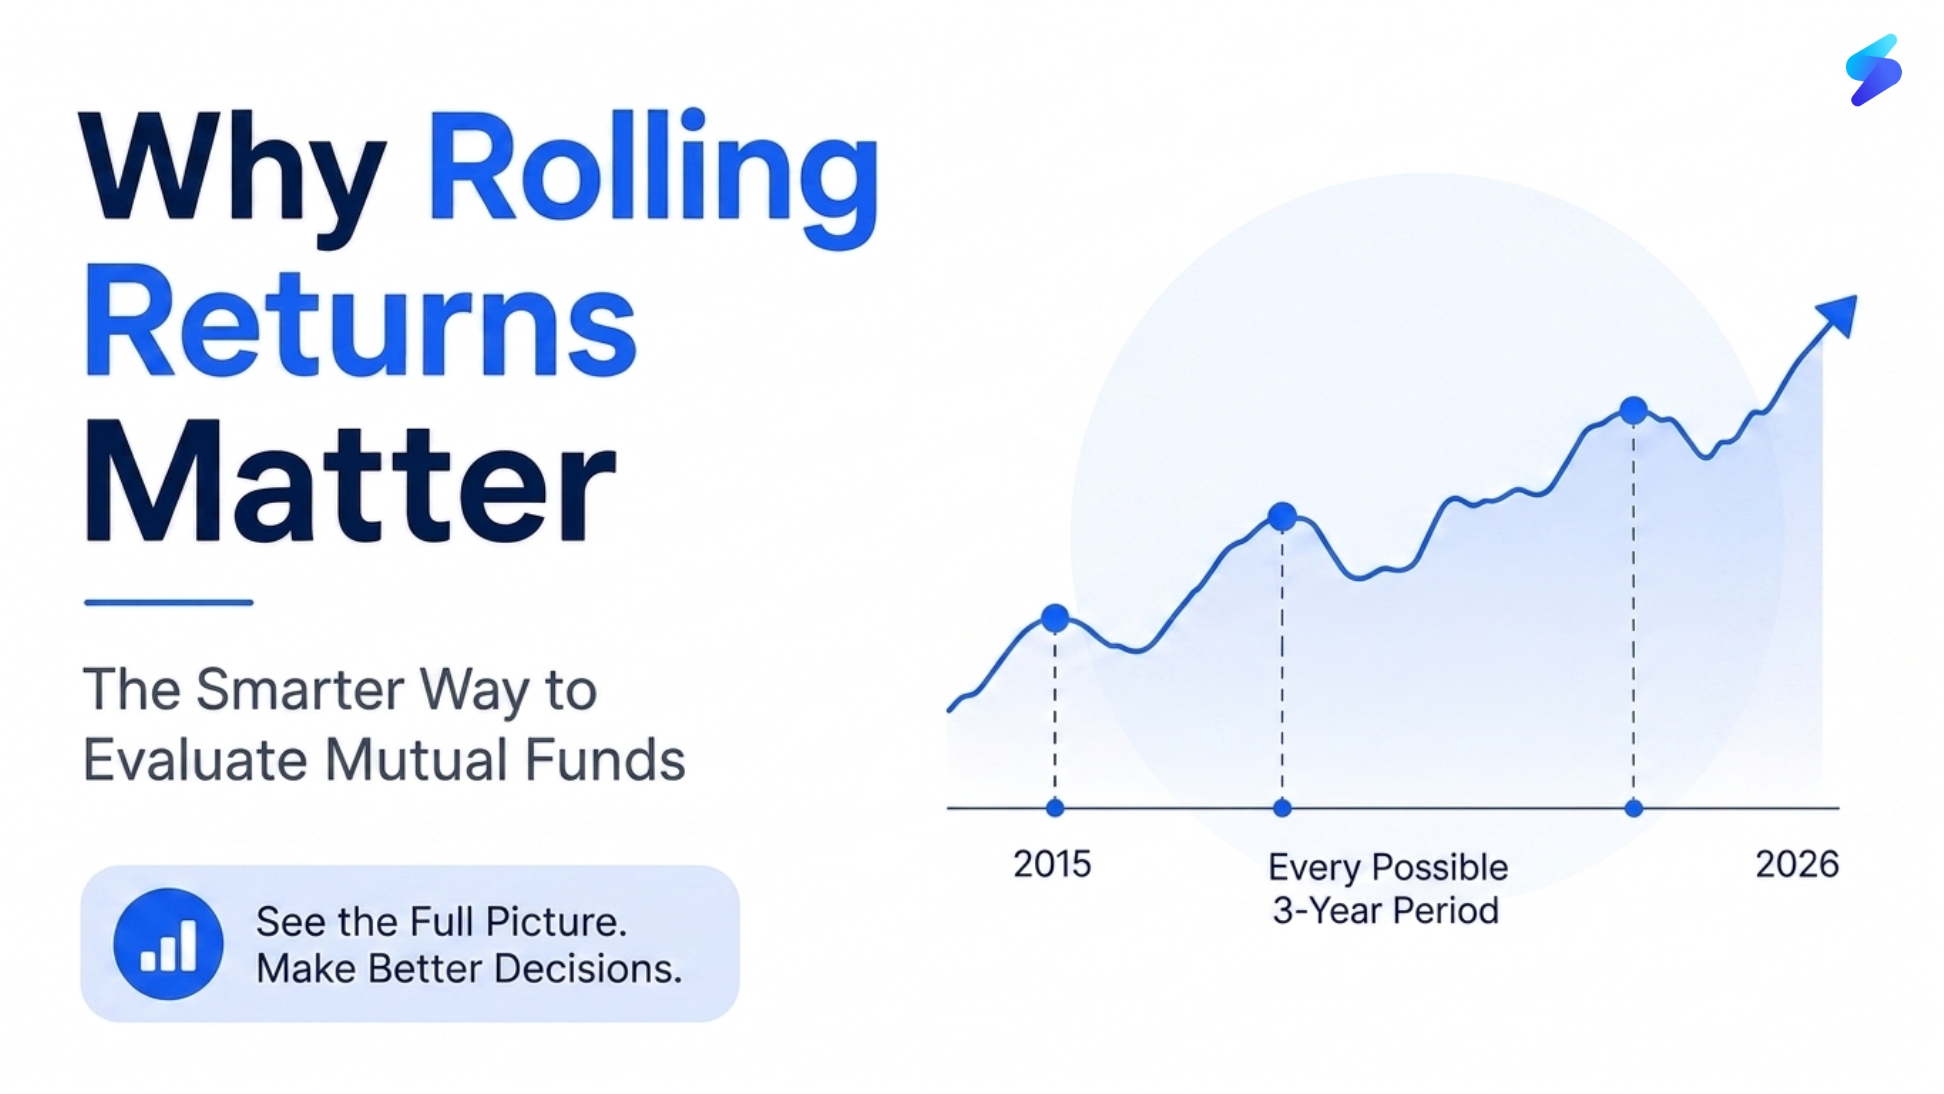
When you look up a mutual fund’s performance, the number you almost always see first is the point-to-point return, the annualised return from one specific date to another. Three-year return: 18.4%. Five-year return: 14.7%. It looks precise. It looks informative.
It is neither.
A point-to-point return is a single data point from a universe of thousands. It tells you how the fund performed if you invested on one specific day and checked your returns on another specific day. Change either date by a few months and the number changes, sometimes dramatically. The 18.4% three-year return you are looking at right now could be 9% or 27% depending on which three years you measure.
This is not a minor technical quibble. It is the core problem with how most investors evaluate mutual funds, and rolling returns are the solution. This article explains what rolling returns are, how they are calculated, what they reveal that point-to-point returns cannot, and how to use the rolling return beat percentage as a practical fund selection tool.
The Problem with Point-to-Point Returns
Imagine two funds: Fund A and Fund B, both showing a 5-year CAGR of 14%.
Fund A delivered approximately 12-16% in each of the five years. Steady, consistent, predictable. An investor who entered at any point during those five years likely saw reasonable returns.
Fund B delivered –8%, –3%, +61%, +12%, and +9% across the five years. The two spectacular years pulled the average up to 14% CAGR. An investor who entered right before the bad years saw a very different experience than the 5-year CAGR suggests. An investor who entered right before the good years looks brilliant, but only because of timing.
The 5-year point-to-point CAGR cannot distinguish between these two funds. It shows 14% for both. But they are not the same fund in any meaningful sense, one is consistent and the other is erratic. Rolling returns can tell the difference. Point-to-point cannot.
Why the Start and End Date Problem Is Worse Than It Sounds
Consider what happens when a market correction occurs at either end of the measurement window. If the correction happened at the start of the 3-year window you are measuring, the base is low and the return looks spectacular. If the correction happened near the end, the return looks terrible. In both cases, the fund’s actual long-term performance may be perfectly average, but the point-to-point number shows something very different.
This is why the same fund can simultaneously show a 3-year return of 22% in one advertisement and 8% in another, both perfectly accurate, both completely misleading in isolation. The fund has not changed. Only the measurement window has.
What Are Rolling Returns?
Rolling returns solve the start-date problem by eliminating the single fixed start date entirely. Instead of measuring from one specific day to another, rolling returns measure a fund’s performance for every possible holding period of a fixed length within a historical window.
Here is how it works in practice. Suppose you want to calculate 3-year rolling returns for a fund over the last 10 years. You calculate the annualised return for:
1 January 2015 to 1 January 2018 — one data point
2 January 2015 to 2 January 2018 — another data point
3 January 2015 to 3 January 2018 — another data point
…and so on, all the way to July 2023 to July 2026.
The result is not one number but hundreds of data points, each representing the 3-year annualised return for a different starting month. Plotted together, they show a distribution of outcomes across every possible entry point over the historical window. Check the example of Parag parikh flexicap fund below.
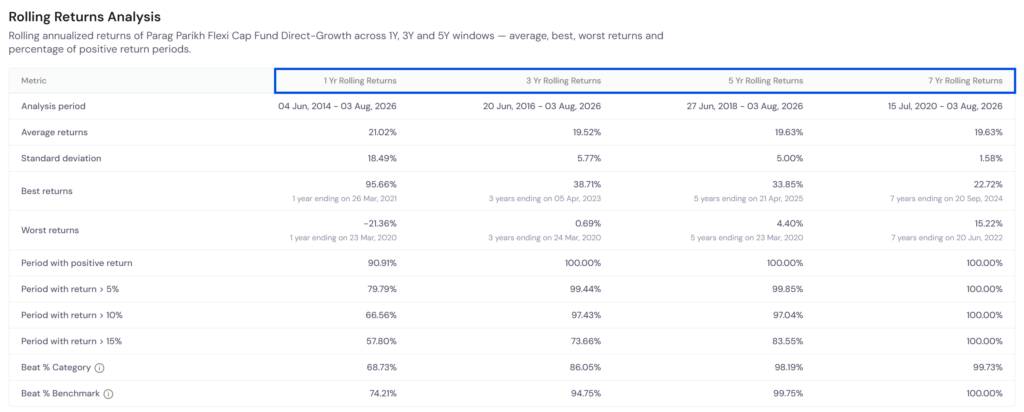
This distribution is what rolling returns actually tell you. The average of all those data points shows the fund’s typical 3-year return across many different market conditions. The minimum shows the worst 3-year outcome a historical investor could have experienced. The maximum shows the best. And the consistency, how tightly clustered or how widely dispersed the outcomes are , tells you whether the fund’s performance is repeatable or luck-dependent.
What Rolling Returns Reveal That CAGR Cannot
Consistency of Outperformance
The most useful application of rolling returns is not the average return itself, it is the percentage of rolling periods in which the fund outperformed its category average. This is called the rolling return beat percentage.
If a fund outperforms its category average in 78% of all 3-year rolling periods over the last 10 years, that is a genuinely consistent outperformer, not a fund that got lucky in one good run. A fund that outperforms in only 38% of rolling periods is underperforming its peers more often than it is outperforming them, regardless of what its current 3-year point-to-point return says.
The beat percentage translates rolling return data into a single, actionable number that directly answers the most important question in fund selection: is this fund consistently better than its peers, or has it just had a good recent run?
The Depth of Downside Risk
Rolling returns also reveal the minimum return an investor could have experienced, the worst 3-year stretch in the fund’s history. A fund with an average 3-year rolling return of 14% but a minimum rolling return of –12% carries very different risk than a fund with the same average but a minimum of +4%.
Point-to-point returns, particularly when measured from a market bottom to a market top, can completely obscure this downside risk. Rolling returns surface it explicitly, because by measuring every possible 3-year window, they inevitably capture the windows that include major market drawdowns.
Base Effect Stripping
When a fund shows unusually high point-to-point returns, it is often because the base period, the starting date, coincided with a market low. The fund has not necessarily outperformed, it has simply measured from a trough. Rolling returns strip the base effect because they average across hundreds of starting points, including both market highs and market lows. The result is a return number that is far less sensitive to when you happen to check.
Why Rolling Returns Matter Even More for SIP Investors
If you invest via Systematic Investment Plan (SIP), rolling returns are not just more informative than point-to-point returns, they are fundamentally more relevant to your actual investing experience.
A SIP investor does not invest on one date and check returns on another date five years later. A SIP investor invests every month (or week), which means every month is a different entry point. Your January instalment has a different entry price than your February instalment, your March instalment, and so on across years of investing.
The return on your SIP portfolio is not the fund’s 5-year CAGR from any single start date. It is an aggregation of returns across many different entry points, some during market highs, some during corrections, some during flat periods. This is precisely what rolling returns measure. The distribution of 3-year rolling returns across hundreds of starting points is a much closer approximation of what a real SIP investor actually experiences than any single point-to-point return.
A fund with a high rolling return beat percentage is a fund that has delivered consistent outperformance regardless of when an investor entered. That consistency is exactly what a long-term SIP investor needs, because they cannot control when they start or what market conditions they encounter in their early months of investing.
How to Read Rolling Returns Practically
When evaluating a fund using rolling returns, focus on four numbers:
| Metric | What It Tells You | What to Look For |
| Average Rolling Return | The fund’s typical annualised return across all historical entry points | Compare to category average — ideally above it |
| Minimum Rolling Return | The worst outcome a historical investor could have seen | Prefer funds where minimum is positive or limited negative over the chosen horizon |
| Maximum Rolling Return | The best outcome a historical investor could have seen | Useful for context; not the primary focus |
| Beat Percentage vs Category | How often the fund outperformed its category average across rolling periods | 60%+ is consistent; 70%+ is strong; below 50% is a red flag |
Always look at rolling returns for multiple time horizons simultaneously, typically 1-year, 3-year, and 5-year rolling windows. A fund that looks consistent on 3-year rolling returns but erratic on 1-year rolling returns may be more volatile than it appears over the medium term. A fund with strong 5-year rolling consistency that is currently going through a weak 1-year rolling period may be in a temporary phase rather than a structural decline.
The Importance of Comparing Within Category
Rolling returns are only meaningful when compared within the same fund category. A small-cap fund will naturally have a wider distribution of rolling returns than a large-cap fund, the underlying universe is more volatile. Comparing a small-cap fund’s minimum rolling return to a large-cap fund’s minimum rolling return tells you nothing useful. Comparing both funds to their respective category averages is the correct approach.
This is why the beat percentage, how often the fund beats its own category average is a more reliable metric than comparing absolute rolling return numbers across different fund categories.
Point-to-Point vs Rolling Returns: A Direct Comparison
| Dimension | Point-to-Point Returns | Rolling Returns |
| Data points | One number | Hundreds of numbers across all entry points |
| Start date sensitivity | Highly sensitive. Changes dramatically with dates | Not sensitive. Averages across all start dates |
| What it reveals | Return from one specific investment date | Distribution of returns across all historical entry points |
| Best for | Quick comparison of absolute return level | Assessing consistency, downside risk, and peer outperformance |
| SIP relevance | Low. SIP investors have multiple entry points | High. Mirrors the multi-entry-point SIP experience |
| Can be gamed | Yes. By choosing start/end dates selectively | No. All periods are included, not selectively chosen |
Where to Check Rolling Returns for Your Funds
Rolling returns require historical NAV data across hundreds of overlapping time windows, not something you can calculate manually from a fund factsheet. You need a tool that runs the calculation automatically and presents the output in a readable format.
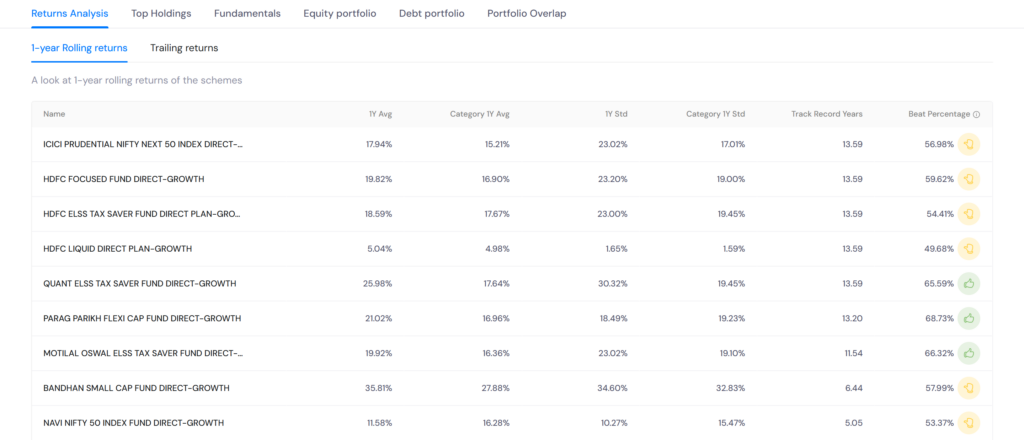
sharpely’s MF Detail pages show rolling return data for mutual funds (as shown in the image above), including the beat percentage versus category average across 1-year, 3-year, 5-year, and 7-year rolling windows. If you want to check how consistently a fund you own or are considering has outperformed its peers across different market conditions and entry points, that is where to look.
You can also check the rolling return analysis of the mutual funds that are in your portfolio using WealthView. A single table will help you identify the risks that you never analysed.
Key Takeaways
Point-to-point returns are a single data point from a universe of thousands. They change dramatically based on which start and end dates you choose, and are easily distorted by base effects, market timing, and selective date selection.
Rolling returns measure every possible holding period of a fixed length. The result is a distribution of outcomes, not one number, but hundreds, that reveals how a fund has performed across different market conditions and entry points.
The rolling return beat percentage is the most actionable metric. A fund that beats its category average in 70%+ of 3-year rolling periods is consistently outperforming peers. A fund below 50% is underperforming more often than not, regardless of its current headline CAGR.
Rolling returns are especially relevant for SIP investors. Because SIP investors enter at multiple points over time, the distribution of rolling return outcomes is a much closer proxy for their actual experience than any single point-to-point return.
Always compare within category. Rolling return comparisons are only meaningful within the same fund category. Use the beat percentage versus category average, not absolute rolling return numbers compared across different fund types.