
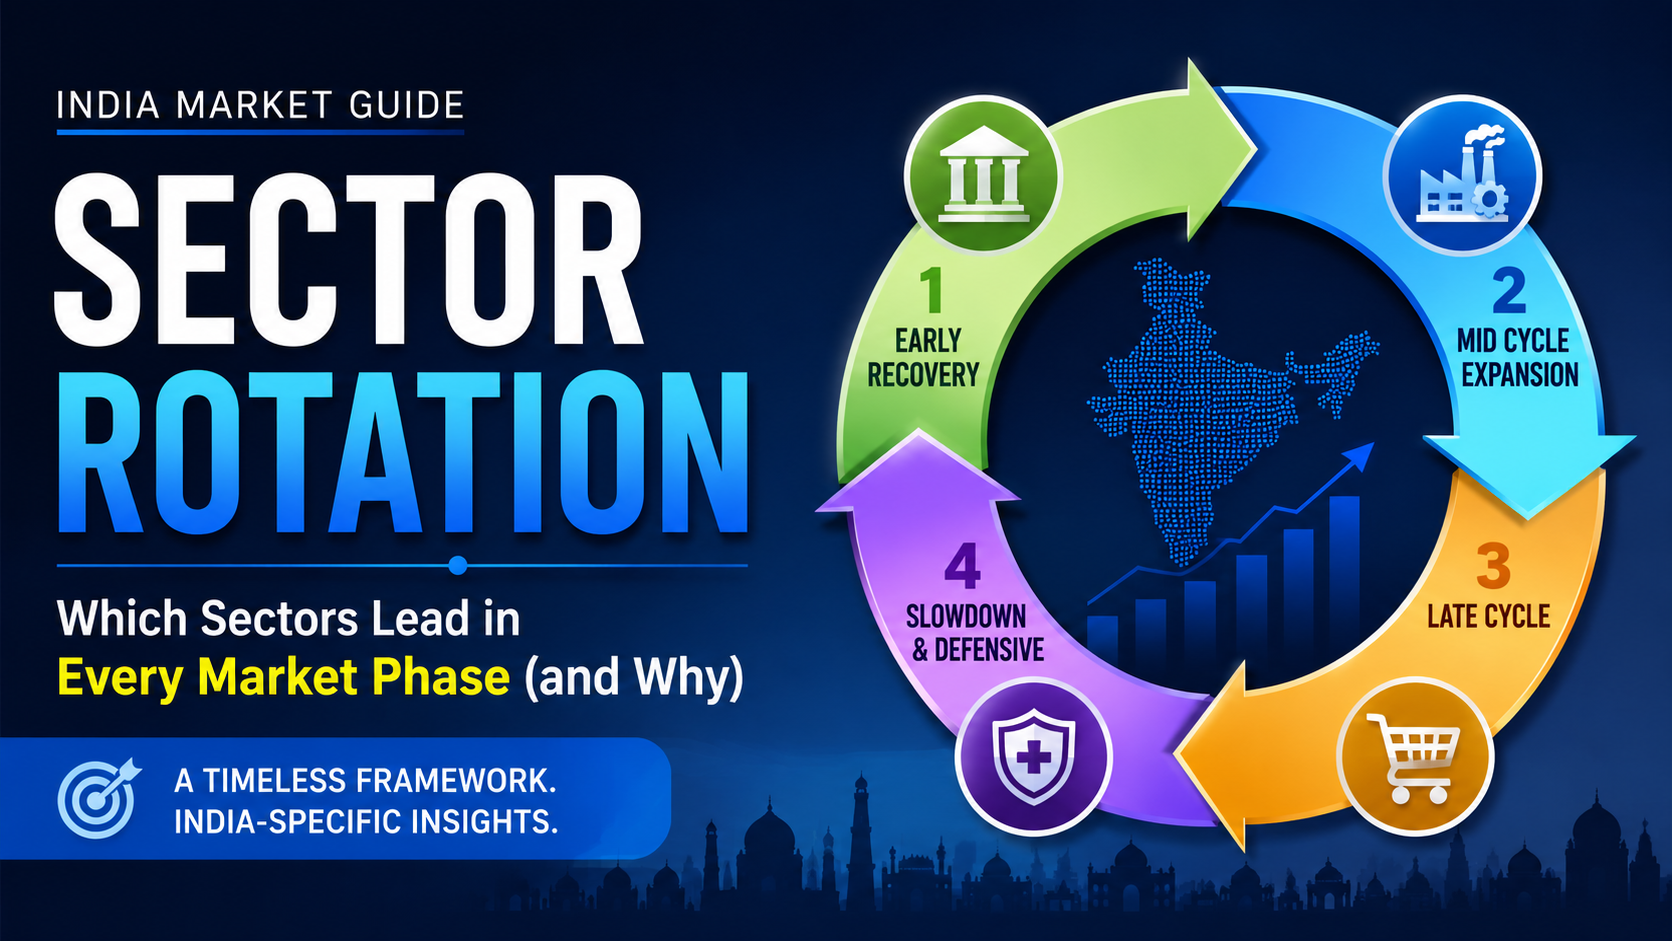
Not all sectors move together. At any point in the market cycle, some sectors are accelerating, others are peaking, and others are quietly building the base for the next move. Understanding which sectors tend to lead in each phase and why, is one of the most durable edges an investor can develop.
This is the core idea behind sector rotation in the stock market: as the economic cycle progresses from recovery to expansion to slowdown and back, money flows systematically from one sector to another. The flows are not random. They are driven by the same underlying economic logic every cycle, interest rate sensitivity, consumer spending patterns, commodity demand, corporate capital expenditure, and the relative safety of different business models at different points in the cycle.
This article maps that logic onto the Indian market, explaining what drives each phase of the cycle, which sectors historically lead during it, and what signals to watch for when one phase is transitioning to the next. The framework is timeless. The sectors and signals are India-specific.
Why Sectors Rotate: The Economic Logic
Sector rotation is not a market phenomenon, it is an economic one. Markets price it in advance, but the underlying driver is always the same: different sectors have fundamentally different sensitivities to the economic conditions that define each phase of the cycle.
A bank’s profitability is directly tied to credit demand and net interest margins, both of which are sensitive to where interest rates are and where the economy is heading. A pharmaceutical company’s revenue, on the other hand, is largely driven by healthcare demand, which is relatively stable regardless of whether the economy is expanding or contracting. A metals company’s margins are almost entirely a function of commodity prices, which are late-cycle and China-demand-driven.
Because these sensitivities differ so sharply, the same economic conditions that are tailwinds for one sector are headwinds for another. Rising interest rates help banks but hurt real estate. A weakening rupee hurts IT companies’ costs but helps export-oriented pharma. A commodity price spike benefits metals but destroys margins for FMCG and paints companies.
Understanding which economic conditions define each market phase, and which sectors are naturally positioned to benefit from those conditions, is the entire foundation of sector rotation strategy.
The Four Market Phases and Their Leading Sectors
Phase 1: Early Recovery
The early recovery phase follows a period of slowdown or correction. Economic activity is picking up from a trough. Interest rates are either falling or have bottomed out. Consumer and business confidence is recovering but not yet strong. Credit growth is beginning to accelerate from a low base.
This is historically the phase with the strongest sector leadership signal, because the shift from contraction to expansion is the most clearly identifiable transition in the cycle, and the sectors that benefit from it tend to move early and sharply.
Banking and Financial Services typically lead the early recovery. As credit demand recovers and NIMs (Net Interest Margins) stabilise or improve, bank earnings inflect positively. The stock market prices this in advance, banking stocks often begin their recovery while the macro data is still mixed. In India, private sector banks with strong retail loan books tend to lead this phase first, followed by PSU banks as the credit cycle broadens.
Auto and Consumer Discretionary follow closely. As consumer confidence returns and disposable income improves, demand for two-wheelers, passenger vehicles, and white goods recovers. Rural recovery, driven by normal monsoon and agricultural income, is a particularly important Indian nuance in this phase, as rural demand drives significant volume for two-wheelers and entry-level vehicles.
Real Estate also tends to perform in early recovery, particularly as interest rates stabilise or begin to fall. Lower home loan rates directly improve affordability, and the sector benefits from pent-up demand that accumulated during the slowdown. In India, residential real estate, particularly affordable and mid-income segments, tends to recover before commercial real estate.
Phase 2: Mid Cycle Expansion
The mid cycle is characterised by broad economic growth, rising corporate earnings, high capacity utilisation, and increasing capital expenditure. Business confidence is strong. Companies that deferred investment during the slowdown are now committing to expansion. Government infrastructure spending tends to accelerate.
Capital Goods and Infrastructure are the defining sector leaders of this phase. As both private and public sector capital expenditure ramps up, demand for industrial machinery, construction equipment, engineering services, and infrastructure development surges. In the Indian context, government-led infrastructure investments: roads, railways, defence manufacturing, power infrastructure, has been a sustained driver of this sector in recent cycles.
IT and Technology tend to perform well in mid cycle expansion, driven by rising corporate technology budgets globally. Indian IT companies, as exporters of technology services, benefit from increased enterprise spending in their key markets (US, Europe). Rupee depreciation, when it coincides with this phase, provides an additional tailwind for IT revenues.
Industrials and Manufacturing broaden the expansion as the capex cycle matures. Companies across logistics, defence manufacturing, railways equipment, and speciality chemicals tend to show strong order book growth during this phase, which translates into multi-quarter revenue visibility.
Phase 3: Late Cycle
The late cycle is the most nuanced phase to navigate. The economy is still growing, but growth is peaking. Inflation is rising, often driven by commodity price increases that accompany strong demand. Interest rates are elevated or still rising. Corporate margins begin to compress as input costs increase. The market is still making highs, but leadership narrows significantly.
Energy and Oil and Gas typically lead the late cycle. Rising crude oil prices, which often accompany the late phase of a global growth cycle, directly benefit upstream oil producers and exploration companies. In India, upstream PSUs like ONGC benefit from higher crude realisations, while downstream refiners face the opposite pressure as marketing margins compress.
Metals and Commodities peak in the late cycle. Steel, aluminium, copper, and other base metals prices are driven by industrial demand, which is highest when the global economy is running at full capacity. Indian metals companies, both ferrous and non-ferrous, tend to show their strongest earnings in this phase. The risk is the same as the opportunity: commodity prices are mean-reverting, and the transition from late cycle to downturn can be rapid and steep.
The late cycle is also the phase where defensive positioning begins to matter, not because defensive sectors outperform yet, but because the risk profile of the cyclical leadership sectors is increasing. Investors who understand the late cycle signal begin reducing cyclical exposure gradually, not all at once.
Phase 4: Slowdown and Defensive
The downturn phase is defined by falling growth, declining corporate earnings, rising credit stress, and falling commodity prices. Central banks typically begin cutting rates in response. Market sentiment deteriorates. Liquidity becomes a premium.
Pharma and Healthcare are the classic Indian defensive outperformers in this phase. Healthcare demand is largely non-discretionary. People need medicines regardless of the economic cycle. Indian pharma companies with strong domestic formulations businesses and export-oriented API manufacturers tend to hold up well when the broader market is under stress. Pharma also benefits from rupee depreciation during downturns, as a significant portion of revenues are US-dollar denominated.
FMCG offers similar defensive characteristics, staples consumption is relatively inelastic. Volume growth may slow during a downturn as consumer spending tightens, but the sector does not experience the earnings collapse that cyclicals do. FMCG stocks often trade at premium valuations during downturns precisely because of this earnings stability.
Utilities and Power provide regulated, relatively predictable earnings in an environment where earnings visibility is scarce. In India, power sector companies with long-term power purchase agreements tend to be defensive holdings during market stress.
The Indian Sector Rotation Map
| Market Phase | Economic Conditions | Leading Indian Sectors | Key Signal to Watch |
| Early Recovery | Rates bottoming, credit recovering, confidence returning | Banking, Auto, Real Estate, Consumer Discretionary | Credit growth inflecting, RBI rate pause or cut |
| Mid Cycle Expansion | Strong growth, rising capex, high corporate confidence | Capital Goods, Infrastructure, IT, Industrials | Order book growth, government capex announcements, IT deal wins |
| Late Cycle | Peaking growth, rising inflation, commodity surge | Energy, Metals, Upstream Oil and Gas | Commodity price spike, margin compression in other sectors, narrowing breadth |
| Slowdown / Defensive | Falling growth, credit stress, rate cuts beginning | Pharma, FMCG, Healthcare, Utilities | Earnings downgrades in cyclicals, defensive sector relative outperformance beginning |
How to Identify When One Phase Is Transitioning to the Next
Knowing the framework is the easy part. Knowing where you are in the cycle right now, and when the phase is about to shift is the harder and more valuable skill. A few signals are consistently more reliable than others.
RBI Policy Direction
The RBI’s rate decisions are one of the clearest cycle signals available in India. A rate cut cycle, or even a pause after a period of hikes, is typically an early recovery signal for banking and rate-sensitive sectors. A rate hike cycle, or language signalling inflation concerns, shifts the signal toward late cycle and defensive positioning. The RBI’s language about growth versus inflation in each policy statement is worth reading for its signal value, not just the rate decision itself.
Credit Growth Data
RBI publishes monthly bank credit growth data. Accelerating credit growth is a mid-cycle signal, companies and consumers are borrowing to invest and spend. Decelerating credit growth or rising NPAs are early warning signals of a slowdown. This data leads market moves, stock prices often anticipate credit growth trends before the data is published, but the trend confirmation is valuable for holding conviction.
Corporate Earnings Breadth
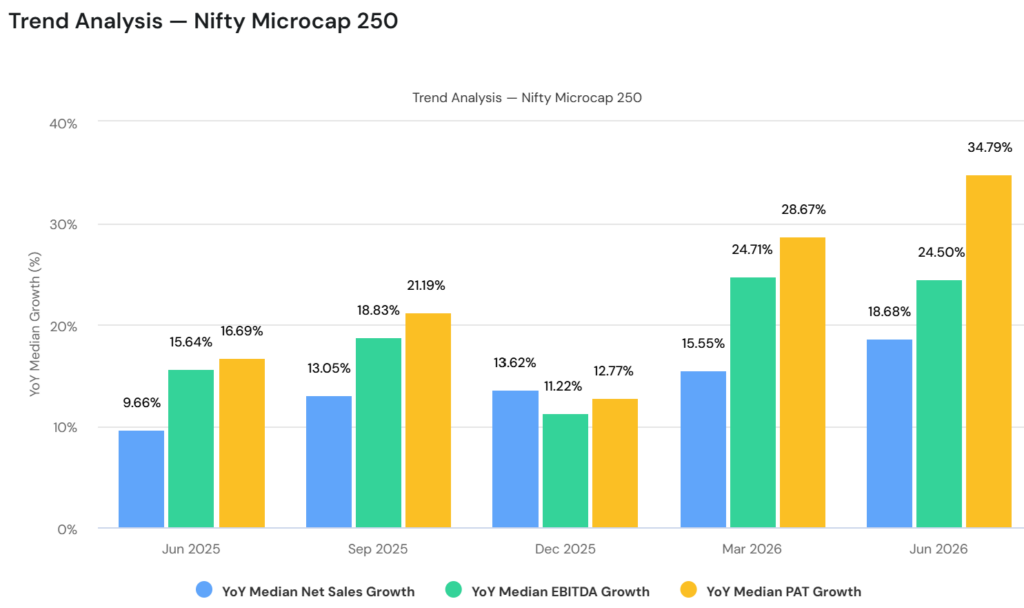
During results seasons, watch how many sectors are showing earnings growth versus slowdown. Broad earnings growth across multiple sectors like banking, auto, capital goods, IT is a mid-cycle signal. Narrowing earnings leadership, only energy and metals beating while others disappoint, is a late-cycle signal. Broad earnings downgrades across cyclicals while defensives hold is the clearest slowdown signal.
You can use our quarterly result tracker to track this effortlessly.
Commodity Prices
Brent crude, steel prices, and copper prices are reliable late-cycle indicators. A sustained surge in all three simultaneously, driven by strong global industrial demand, typically signals that the late cycle is well underway. A sharp reversal in commodity prices particularly if accompanied by demand destruction signals from China, is typically the transition signal from late cycle to slowdown.
Tracking Sector Rotation in Real Time
Reading the economic signals above tells you the fundamental case for where the cycle is heading. But market pricing moves ahead of the economic data, sectors begin rotating before the macro confirmation arrives. This is where a Relative Rotation Graph (RRG) is a genuinely useful complement to the economic framework.
An RRG plots every sector’s relative strength and relative momentum simultaneously on one chart, showing which sectors are building momentum against the benchmark (Improving quadrant), which are in sustained leadership (Leading quadrant), which are beginning to fade (Weakening), and which are underperforming (Lagging). The tails on each sector’s dot show the direction of travel, so you can see a rotation building before it is complete.
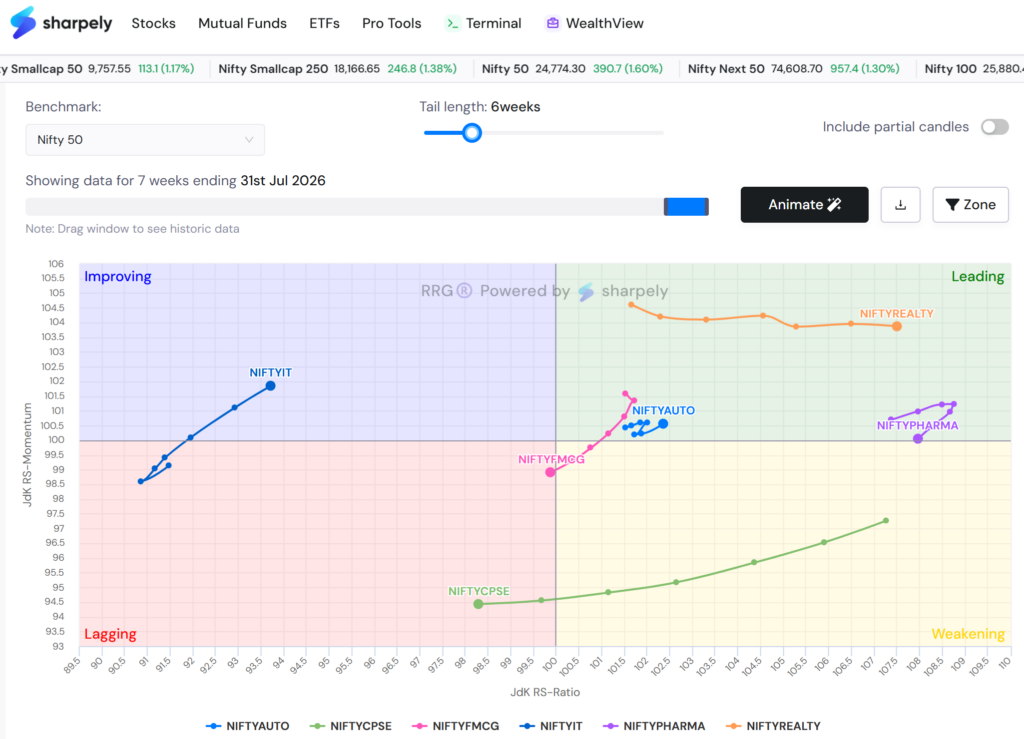
When the economic framework says ‘we may be transitioning from early recovery to mid cycle’, the RRG lets you check whether Capital Goods and Infrastructure are already moving from Improving to Leading, which would confirm the market is pricing the transition ahead of the macro data. That convergence of economic signal and technical confirmation is where the highest-conviction sector rotation trades tend to emerge.
sharpely’s RRG tool under Pro Tools is built for exactly this, plotting Indian sectoral indices on a weekly basis against the Nifty 50 benchmark, with tails showing the last 10 weeks of relative movement. It is the most direct way to see in real time which sectors are rotating and in which direction.
What Sector Rotation Strategy Cannot Do
The sector rotation framework is a probabilistic guide, not a deterministic calendar. Economic cycles do not follow fixed timelines. The early recovery phase can last six months or three years. The late cycle can compress rapidly or extend for years driven by commodity supercycles. India-specific factors, monsoon, government policy, RBI decisions, global crude prices can override the textbook rotation sequence entirely.
Three caveats that experienced investors keep front of mind:
The market leads the economy. Sectors begin rotating before the macro data confirms the new phase. By the time a phase transition is obvious in the economic data, the leading sectors have already moved. Acting on confirmed economic data alone means consistently being late to the rotation.
Phases overlap. Real cycles are not clean sequential transitions. In the same quarter, banking might be in early recovery mode while metals are already in late-cycle territory. The rotation map is a framework for thinking, not a rigid sequence every sector follows simultaneously.
Stock selection within sectors still matters. Identifying the right phase and the right sector gets you to the right neighbourhood. But within Banking, for example, private banks and PSU banks can diverge significantly even in the same phase of the cycle. The sector call and the stock call are separate decisions, and both need to be right for the trade to work.
Key Takeaways
Sector rotation is driven by economic logic, not market sentiment. Different sectors have fundamentally different sensitivities to interest rates, consumer confidence, capital expenditure, and commodity prices, which is why the same conditions that lift one sector hurt another.
Each phase has a clear set of Indian sector leaders. Early recovery favours Banking, Auto, and Real Estate. Mid cycle favours Capital Goods, Infrastructure, and IT. Late cycle favours Energy and Metals. Slowdowns favour Pharma, FMCG, and Healthcare.
Phase transitions show up in economic signals before they are obvious. RBI policy direction, credit growth data, earnings breadth, and commodity prices are the four most reliable early warning signals for a phase shift.
The RRG confirms what the fundamentals suggest. When the economic framework points to a phase transition and the RRG shows the relevant sectors beginning to rotate on the chart, the two signals together provide significantly more conviction than either alone.
The framework is timeless. The cycle is not. The rotation sequence repeats across every economic cycle, but the timing, duration, and magnitude of each phase varies. Use the framework as a mental model for where you are, not as a schedule for what comes next.