Hi,
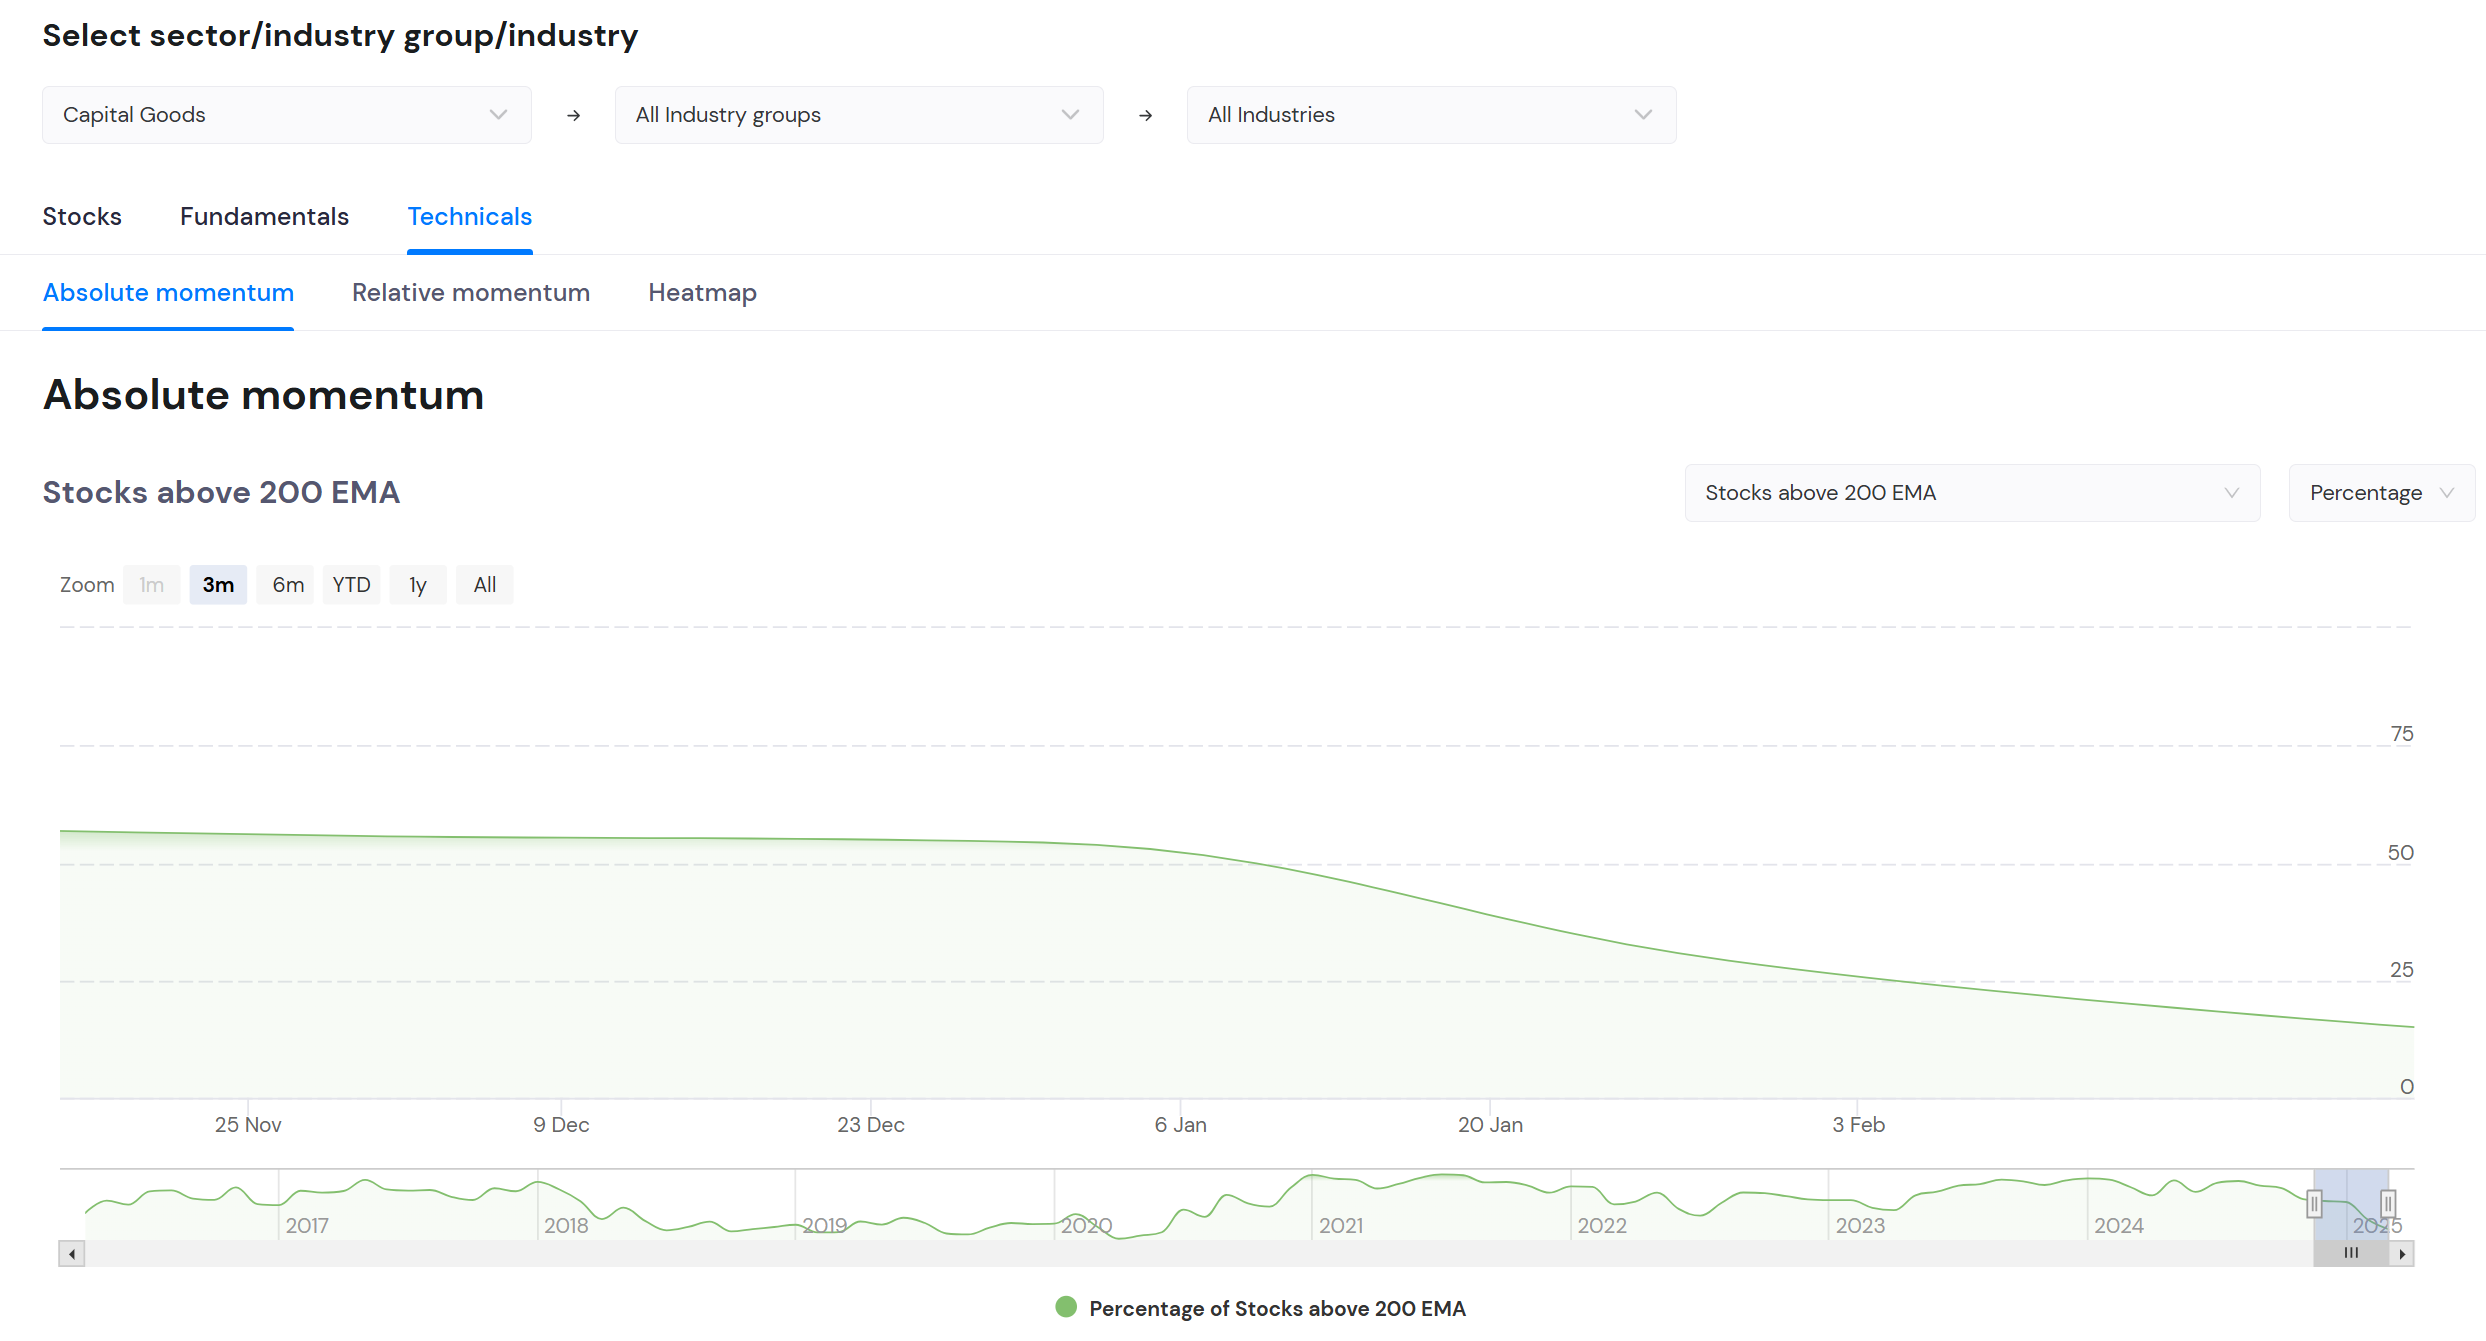
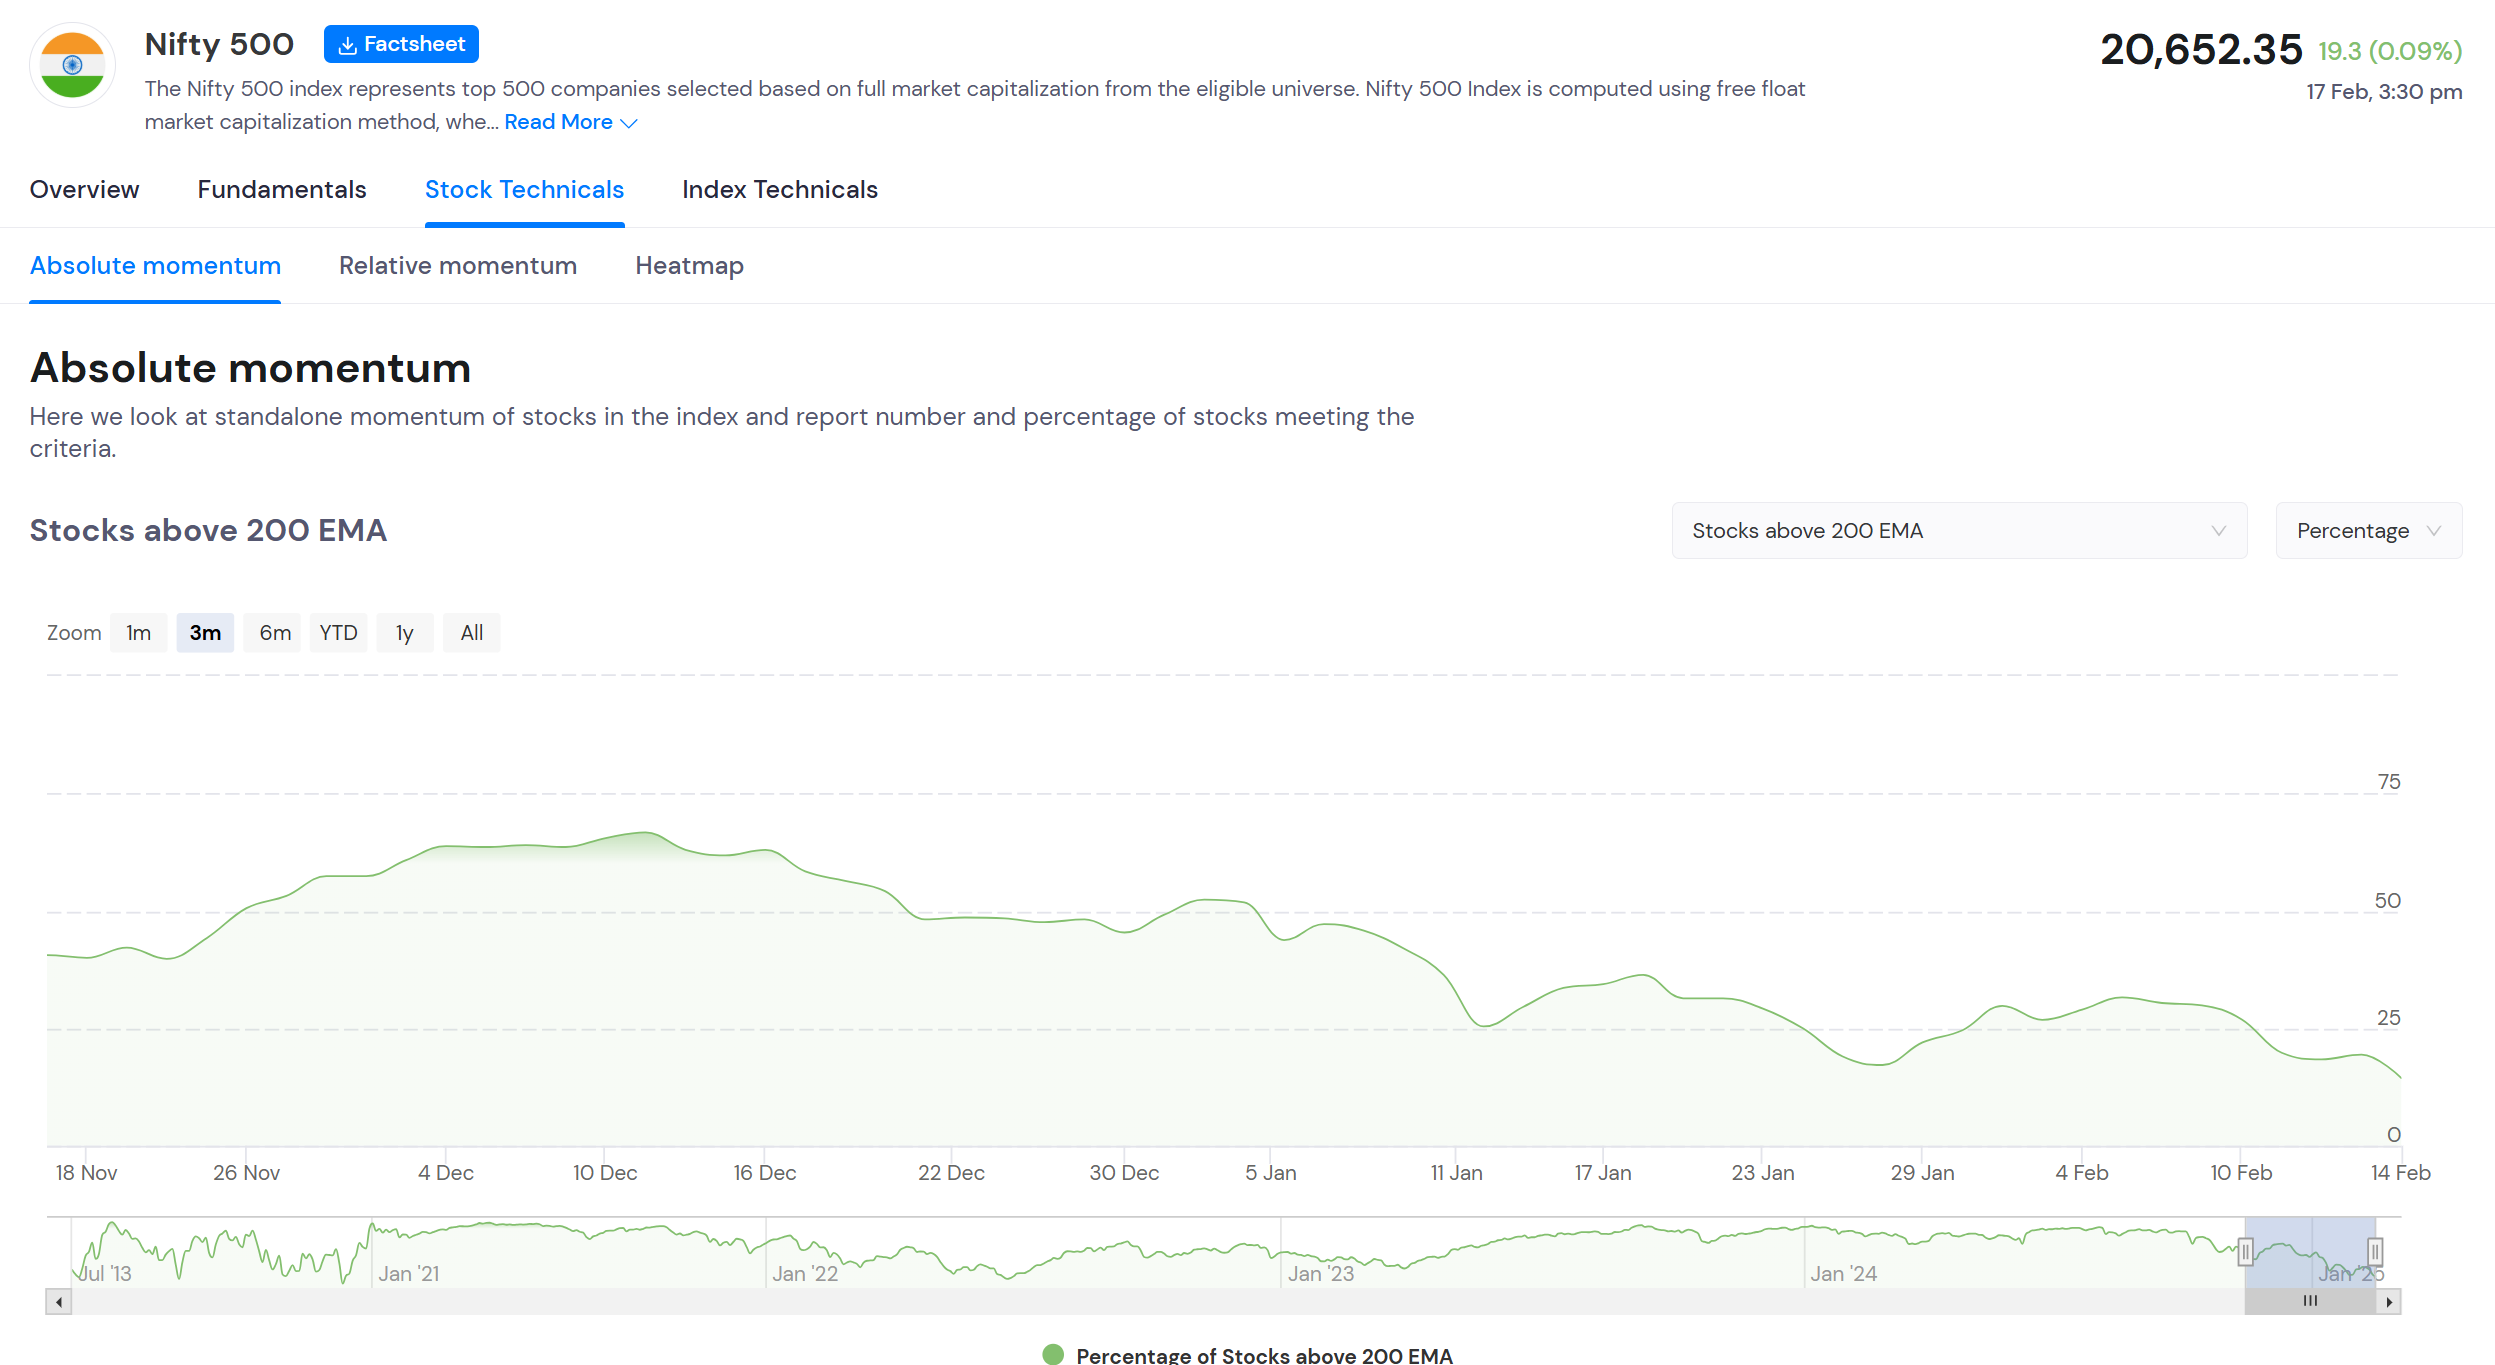
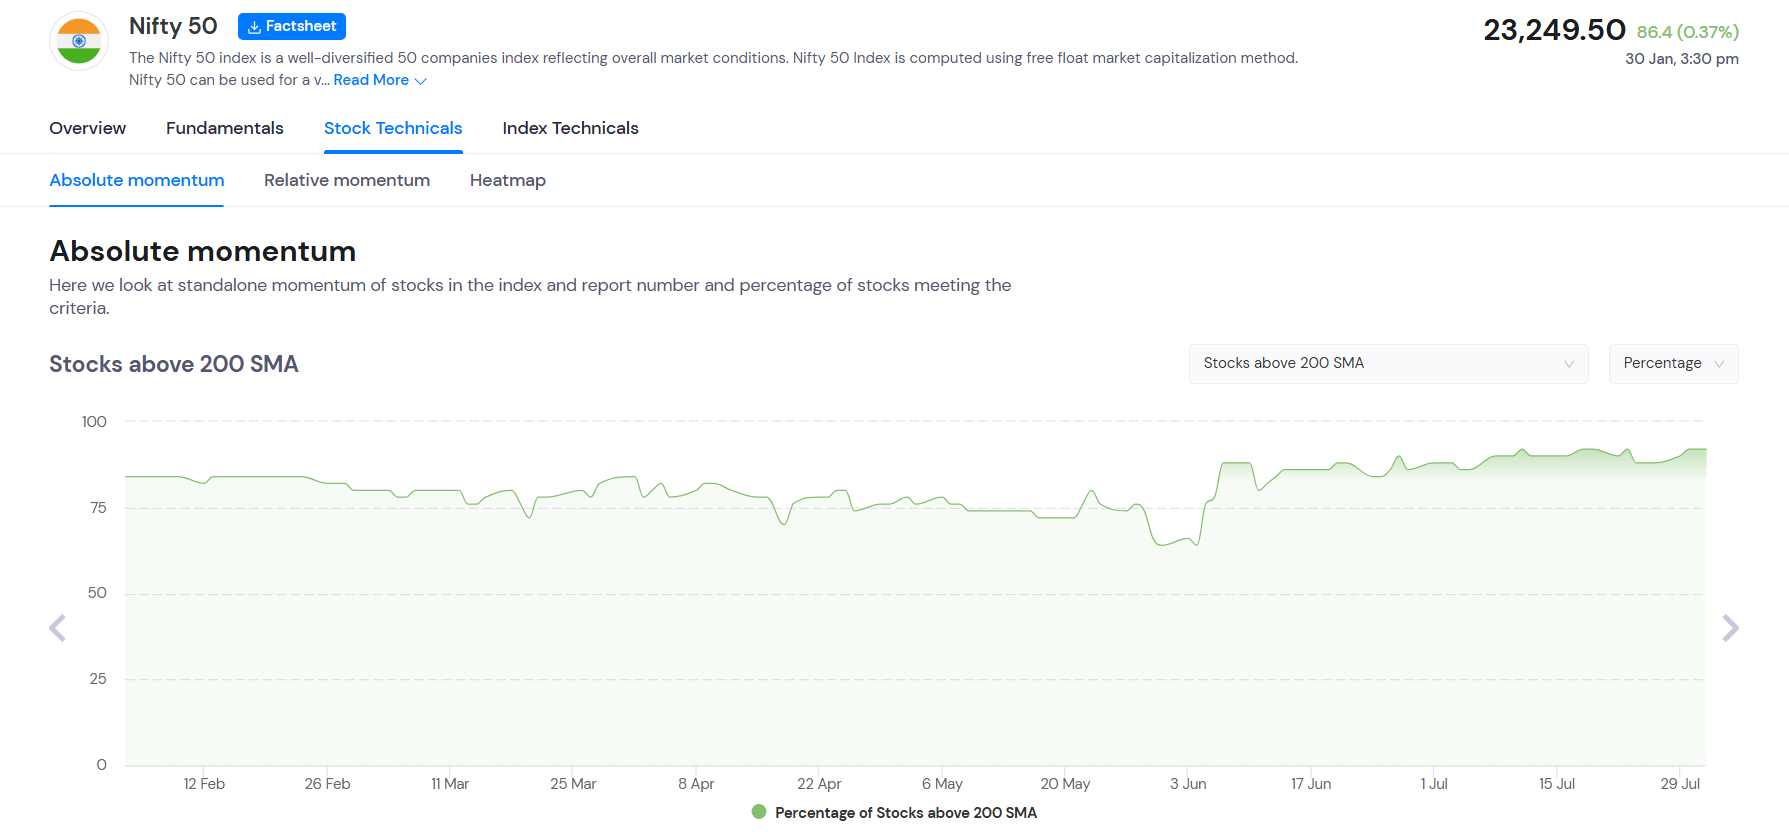
The current framework only displays a fixed time window within the momentum charts. This can be cumbersome when attempting to compare with longer histories. I would suggest adding a slider to dynamically select the time window of choice to make it more user friendly.
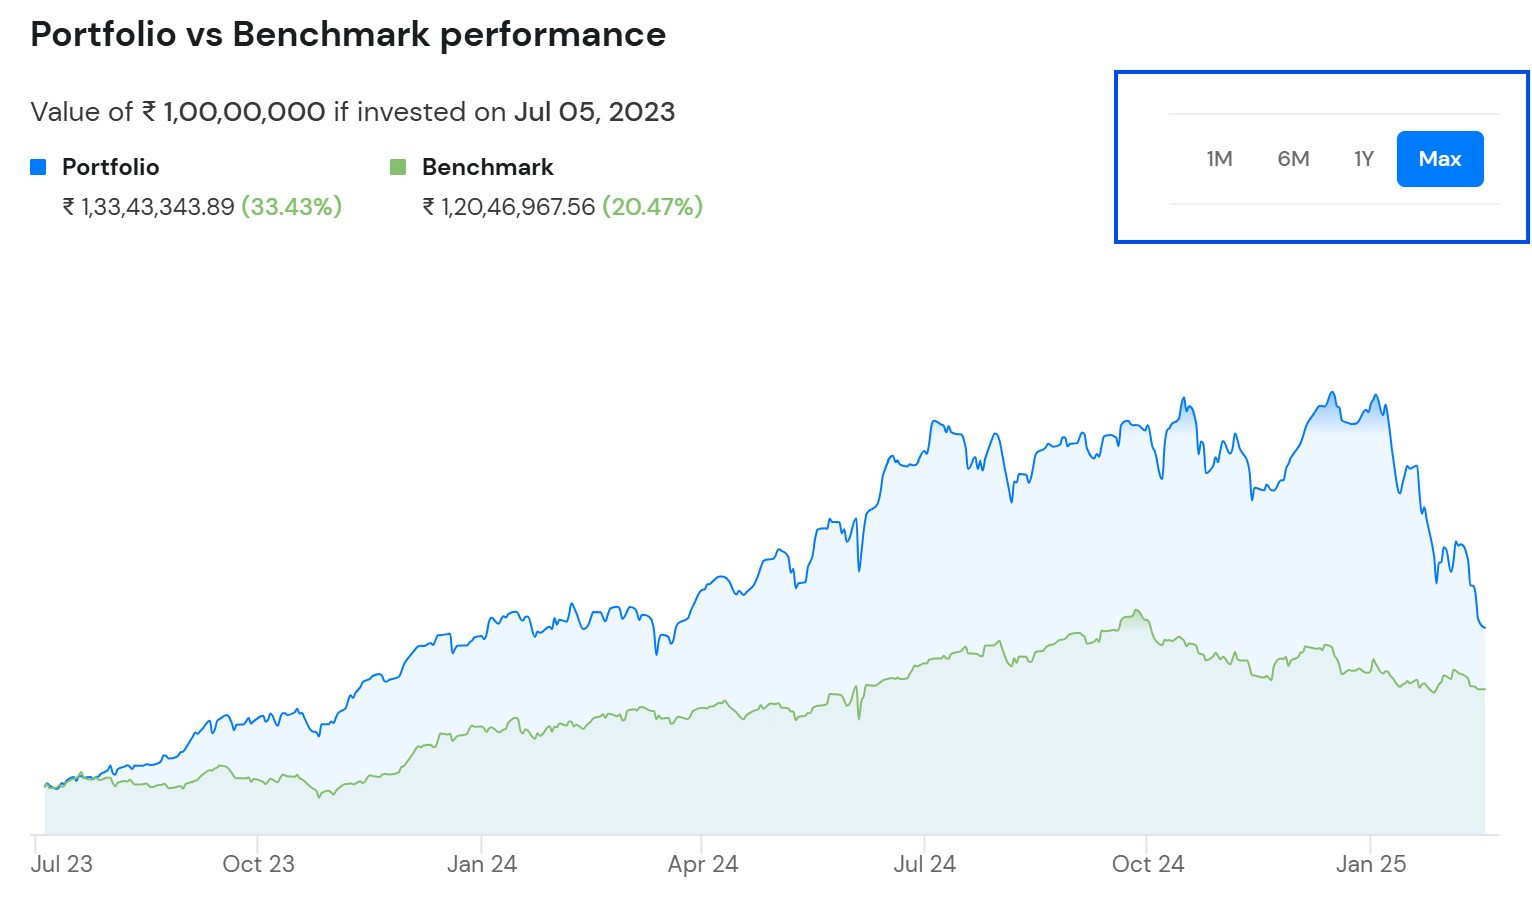
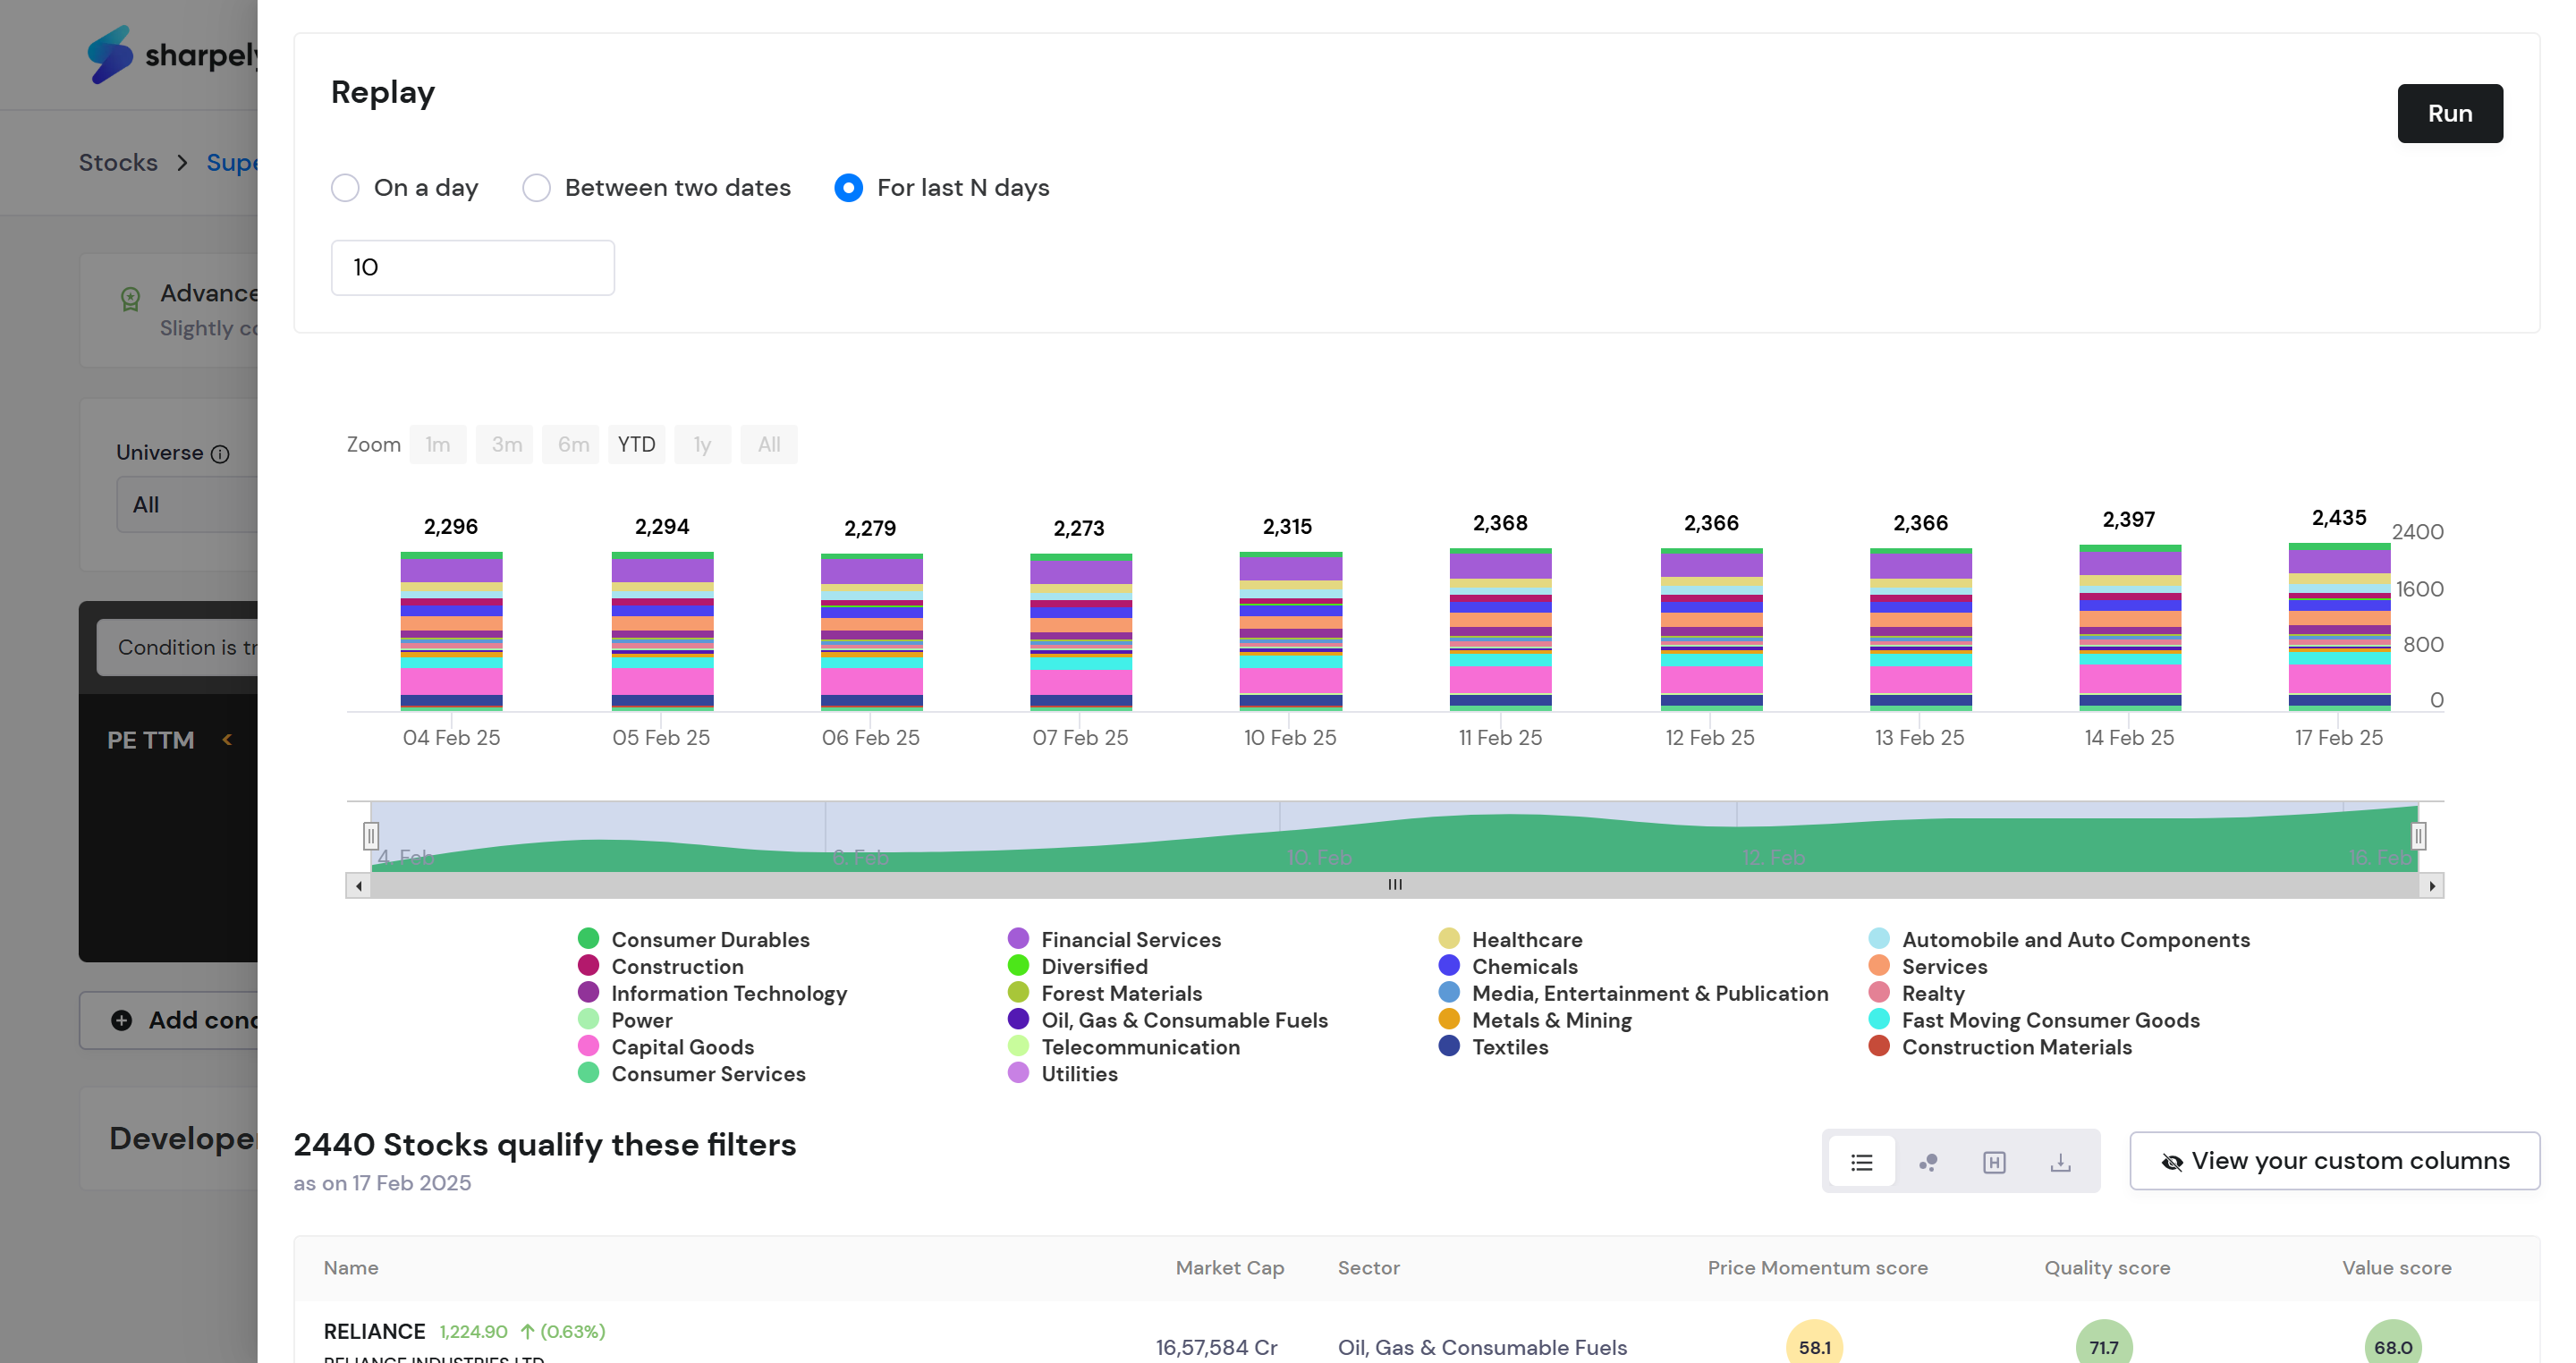
Also, this can be extended to other charts on the platform as well which rely on manually selecting the start and end dates (such as backtest performance and stock price charts).
Example for slider: https://plotly.com/python/range-slider/