In this article, we will give you an overview of building our alpha.
Step 1: Select how you want to create your alpha.
Remember, alpha (or factor) in our context is a value associated with each stock in the universe at each point in time.
There are 3 ways you can build your alpha.
Option 1: Use any of 400 pre-built metrics on sharpely as alpha.
The value of the metric is the alpha value. For example, if you want to analyse PE Ratio, you don’t need to do anything fancy but just go ahead and select PE Ratio from the dropdown. You can also specify the universe on which you want to analyse, and the entire analysis will be restricted to stocks in the universe. Keep the universe to Nifty 500 or Nifty Total Market is recommended as it (1) filters out extremely small-cap stocks that can skew the analysis and (2) faster analysis.
Option 2: Use the weighted sum of scores.
At times, you may want to create an alpha, which is a combination of 2 or more metrics. But you cannot directly sum them because their scale can be different.
For example, if your alpha is PE Ratio + 21 Day Volume, this alpha will be totally dominated by volume (which will be very large compared to PE Ratio). In such cases, you score each of the metrics individually to normalise them, and then add them up by assigning weights to each score.
You can use our UI builder to easily create such alphas and use different scoring models – percentile scoring and Z scoring. The screenshot below shows how we have combined 3 metrics to create a single alpha value:
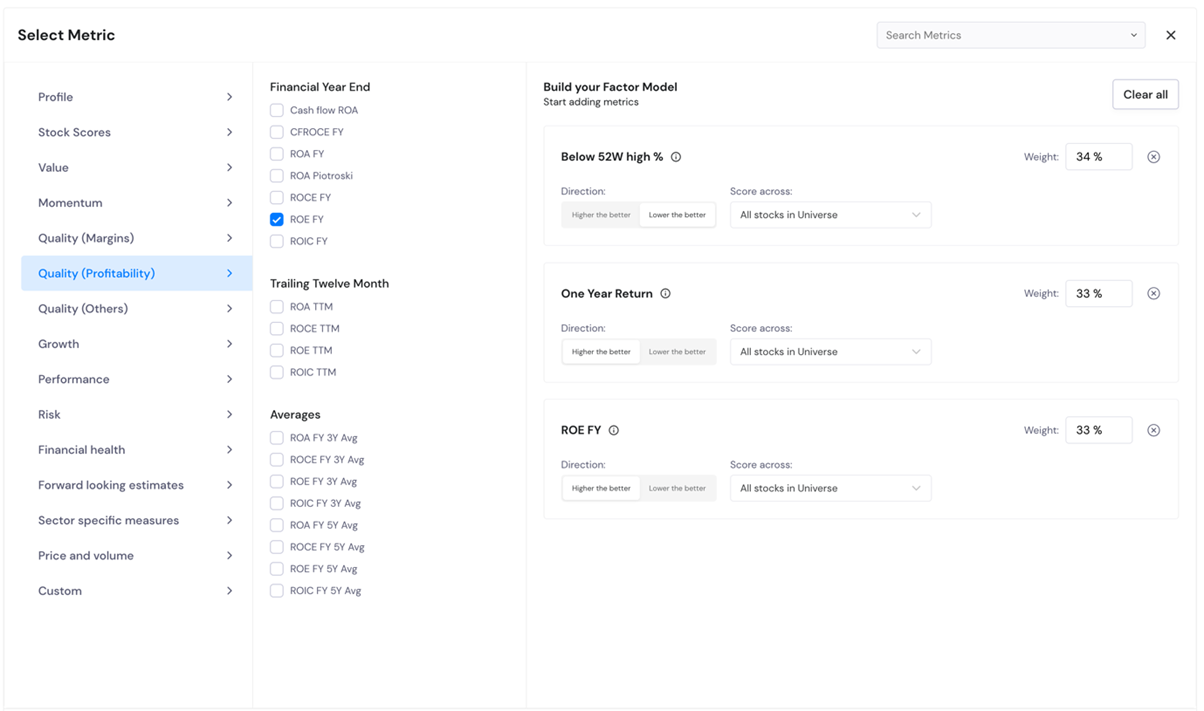
Note that you can use pre-built metrics as well as your own custom-defined metrics.
Option 3: Use Alpha Builder
This is the most flexible option and can be used to build any custom alpha. This option might seem a bit overwhelming at first but once you get used to our editor, this is the easiest and obviously the most flexible option.
Screenshot below shows a custom alpha created, which is the Closing price divided by the simple moving average of EMA 9.

Screenshot below shows how we have used the custom editor to create the exact same alpha as we created using Option 2 above.

Step 2: Define analysis parameters
Here you can select the date range for analysis. The maximum allowed is 3 years, and the minimum is 1 year.
Then you need to select the forward return period for analysis. These are the periods for which the analysis will be conducted.
By default, these values are 5D, 21D and 63D. This means that the analysis will assess the ability of your alpha to predict the next 4 days, next 21 days and next 63 days return. You can select other values as well. See screenshot:

Note that this parameter is only used for Alpha Analysis and not for the quantile back test.
The third parameter helps you decide how to bucket your stocks, both for forward return period analysis and quantile back test.
This is where you decide how to bucket your stocks. You can either bucket by quantile or by actual values. Bucketing by quantile is more common and recommended in most cases.
Suppose you go with the default value of 5 quantiles. This means that on each date of analysis (in your chosen date range), stocks will be bucketed into 5 quantiles sorted by alpha value in ascending order. So, if your alpha is ROE, the bottom quantile will contain stocks with the lowest ROE, while the top quantile will contain stocks with the highest ROE. When you do a return analysis or a quantile back test, you can then compare the performance of each quantile to assess your alpha.
At times, working with quantiles might not be suitable. This is the case when your alpha either takes distinct integer values (example - Piotroski F-Score where values are 0 to 9) or in the case of oscillating indicators like RSI, where you need values near to 20,30,70,80.
Suppose you are analysing Piotroski F-Score, then you can create 10 bins to analyse the values of each value of score by specifying the upper range of each bin. See screenshot.

Or if your alpha is RSI, you would want to analyse values closer to 20, 30, 70 and 80. Then you can define buckets as shown below:

Note: Be careful when using this option for bucketing. Use this only if you know the exact range of your alpha values.
Step 3: Conduct analysis
Now that your alpha is built and your parameters are defined, you are ready to start the analysis. There are 2 different levels of assessment that you can do:
1. A detailed alpha analysis, which helps you understand the predictive power of your alpha. We discuss this in more detail here.
2. A detailed quantile back test, which shows the performance of portfolios in different buckets as chosen in Step 2 above. We discuss this in more detail here.