
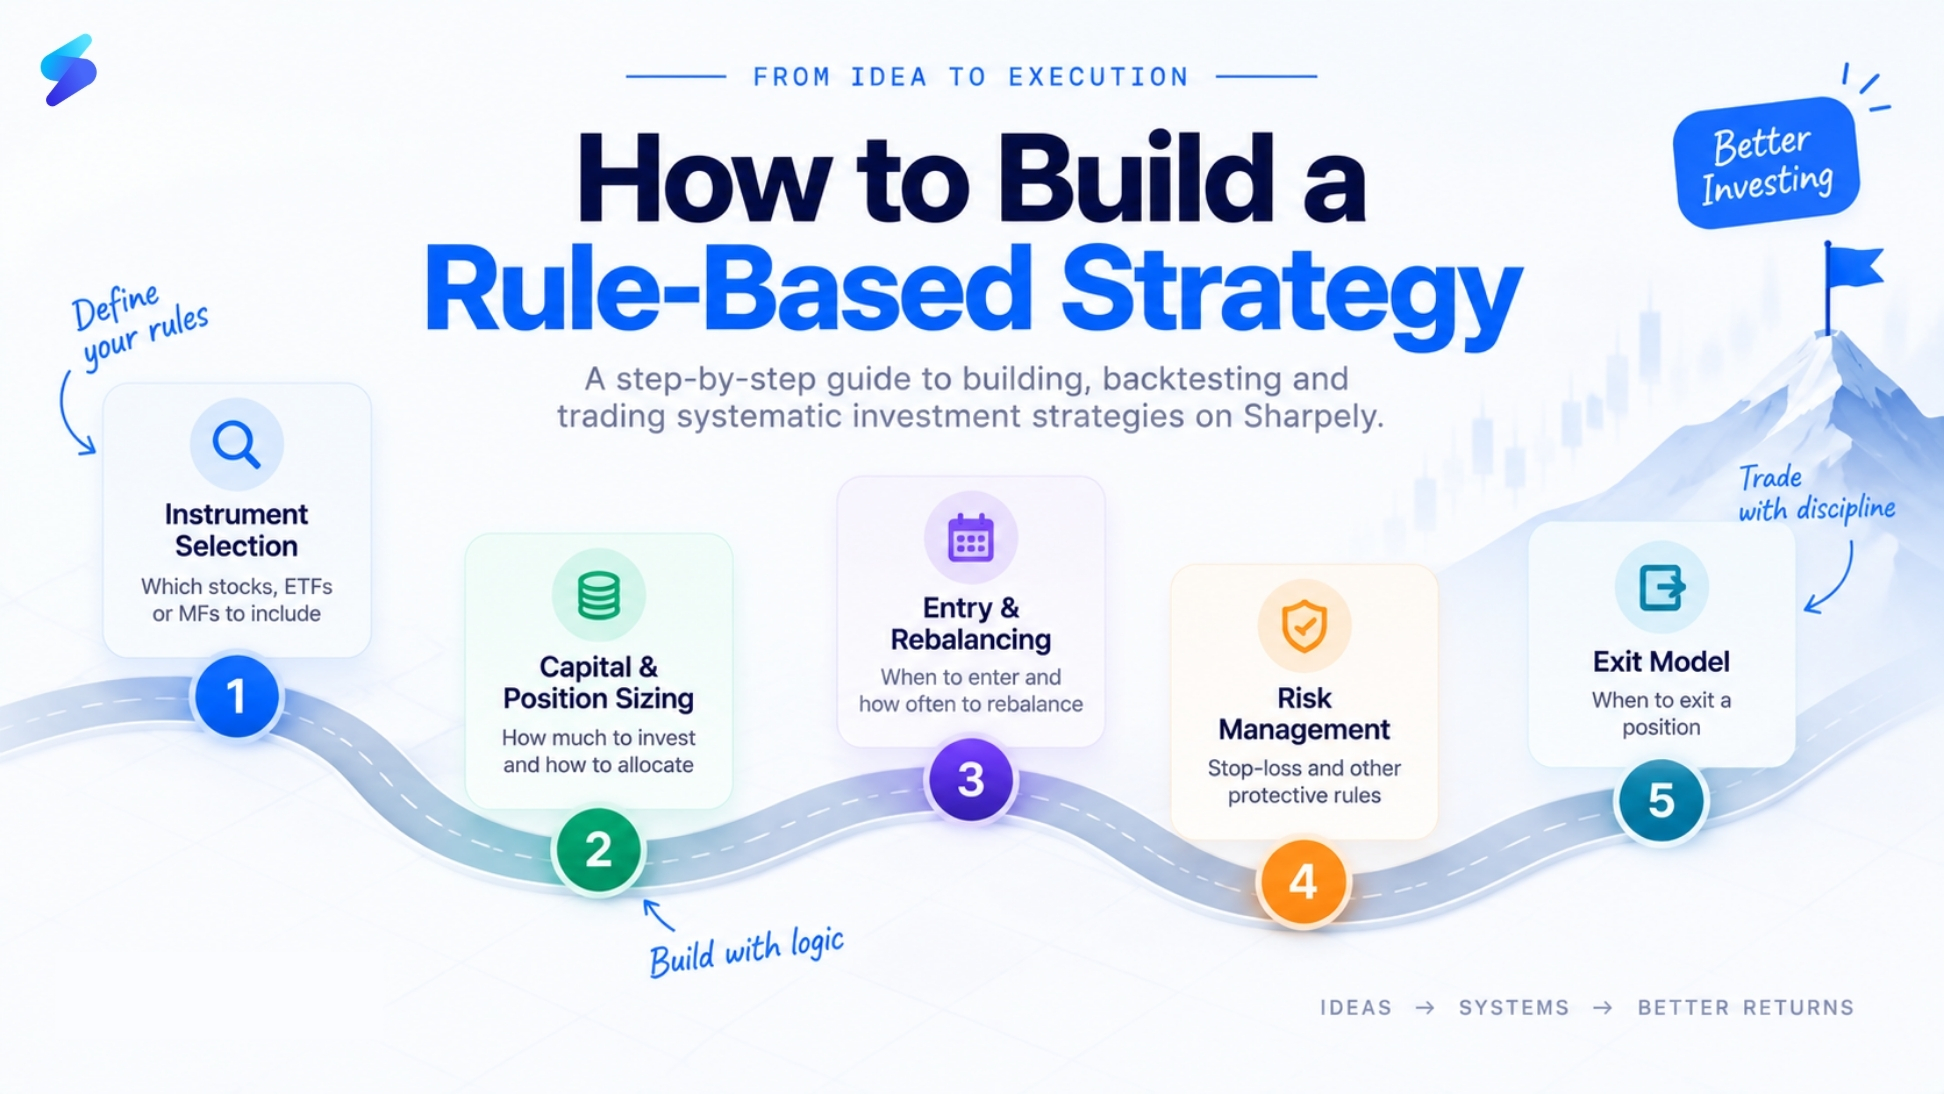
Most investors make investment decisions the same way every time, with a different rationale. One month they buy a stock because of strong earnings. The next month they buy because it broke out technically. The month after that, because someone they trust recommended it. Each decision feels logical in the moment. Taken together, they form no coherent system.
A rule-based investment strategy is the antidote to this. It is a set of clearly defined, consistently applied conditions that determine what you buy, when you buy it, how much you allocate, when you exit, and how you manage risk, without changing those rules based on mood, market noise, or recent performance.
This article walks through the complete process of building a rule-based strategy on sharpely’s Strategy Builder, from the first idea all the way through to paper trading and live execution. Every parameter is covered in sequence, exactly as it appears in the builder.
What Is a Rule-Based Strategy?
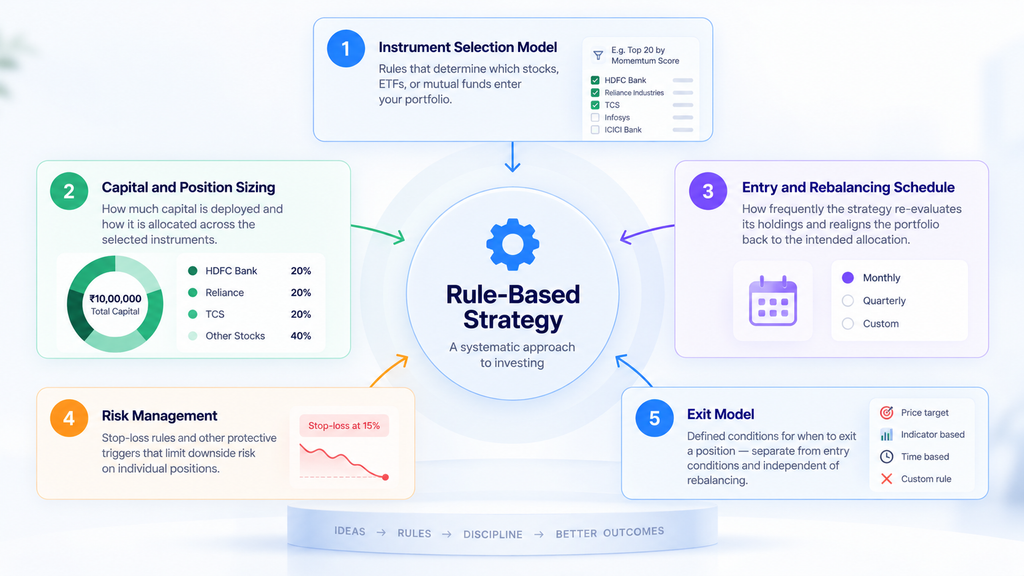
A strategy is defined by five components that work together as a unified system:
1. Instrument selection model: The rules that determine which stocks, ETFs, or mutual funds enter your portfolio. This is the engine of the strategy — everything else is built around it.
2. Capital and position sizing: How much total capital is deployed and how that capital is divided across the instruments selected by the model.
3. Entry and rebalancing schedule: How frequently the strategy re-evaluates its holdings and realigns the portfolio back to the intended allocation.
4. Risk management: Stop-loss rules and other protective triggers that limit downside on individual positions.
5. Exit model: Separate, defined conditions for when to exit a position, distinct from the entry conditions and independent of the scheduled rebalancing.
A strategy that has all five components defined, documented, and consistently applied is a genuinely systematic strategy. One that has only the first component, a stock selection idea, without the rest is an idea, not a strategy.
What Types of Strategies Can You Build?
sharpely supports five types of strategies, each suited to a different investing approach:
| Strategy Type | How Stocks/Instruments Are Selected | Best For |
| Static Stock Basket | Fixed, user-defined list of stocks | Tracking a curated set of conviction holdings with defined weights |
| Dynamic Strategy: Screener | Stock screener conditions (technical + fundamental) | Rule-based selection that updates automatically as new stocks qualify or exit |
| Dynamic Strategy: Factor Model | Factor score ranking (QVM, QVMG, or custom model) | Quant-style investing using pre-built or custom multi-factor scores |
| Mutual Fund Basket | Fixed, user-defined list of MFs | Systematic MF allocation with defined rebalancing schedule |
| ETF Basket | Fixed, user-defined list of ETFs | Index-based or thematic ETF portfolio with rule-based rebalancing |
One important note on limitations: sharpely’s strategies are portfolio-based, long-only, and equity cash segment only. Intraday trading, short selling, and F&O are not supported. Strategies trade once per day at most. These constraints reflect the classic quant investing framework the platform is built around, not a gap in functionality.
The Four-Step Strategy Workflow
Before building a specific strategy, it helps to understand the overall workflow that sharpely is designed around. This is the same process professional quant funds follow, now available to individual investors.
Step 1: Research and Idea Generation
A strategy starts with a hypothesis: why should these stocks outperform? The hypothesis might come from factor investing research (momentum stocks outperform over 6-12 months), fundamental analysis (high ROE + low debt companies compound better), or technical patterns (stocks near 52-week highs with improving momentum tend to continue rising).
On sharpely, this research phase is supported by the Super Screener or Factor Model, where you can test individual screening conditions, backtest single factors, and iterate on stock selection logic before committing it to a full strategy. The screener is the research sandbox; the strategy builder is where the validated idea becomes a deployable system.
Step 2: Build and Backtest
Once the idea is defined, you codify it into an executable strategy by setting all five components listed above. The backtest engine then simulates the strategy against historical data, showing what would have happened if you had run these rules in the past.
sharpely uses a complex event processing backtesting engine designed to produce results as close to real trading as possible, including survivorship-bias-free stock universes and point-in-time data. Take backtested results seriously as a directional indicator, but not as a guarantee of future performance.
Step 3: Paper Trade
Before deploying real capital, sharpely requires every strategy to be paper traded first. Paper trading simulates real-world execution, the strategy rebalances automatically on schedule, generates actual orders based on current market data, and tracks performance against the benchmark, without any real money at risk.
Paper trading is the ‘fail first’ mechanism. A strategy that looks excellent in backtest but performs differently in paper trade — perhaps because of execution slippage, data lag, or market conditions not captured in the historical window — needs to go back to the drawing board before going live. This mandatory paper trade step protects investors from taking live positions in unproven strategies.
Step 4: Go Live
Once you have paper traded the strategy for a sufficient period and are satisfied with its real-world behaviour, you can take it live. In live mode, the strategy generates an order list on each rebalancing date, a complete set of buy and sell instructions based on the strategy rules. You review these orders and execute them manually with your broker. There is no auto-execution. You retain full control over timing and execution while the strategy provides the systematic signal.
Building a Strategy: Parameter by Parameter
Step 1: Choose Your Instrument Selection Model
The instrument selection model is the core of your strategy. For dynamic stock strategies, you have two options:
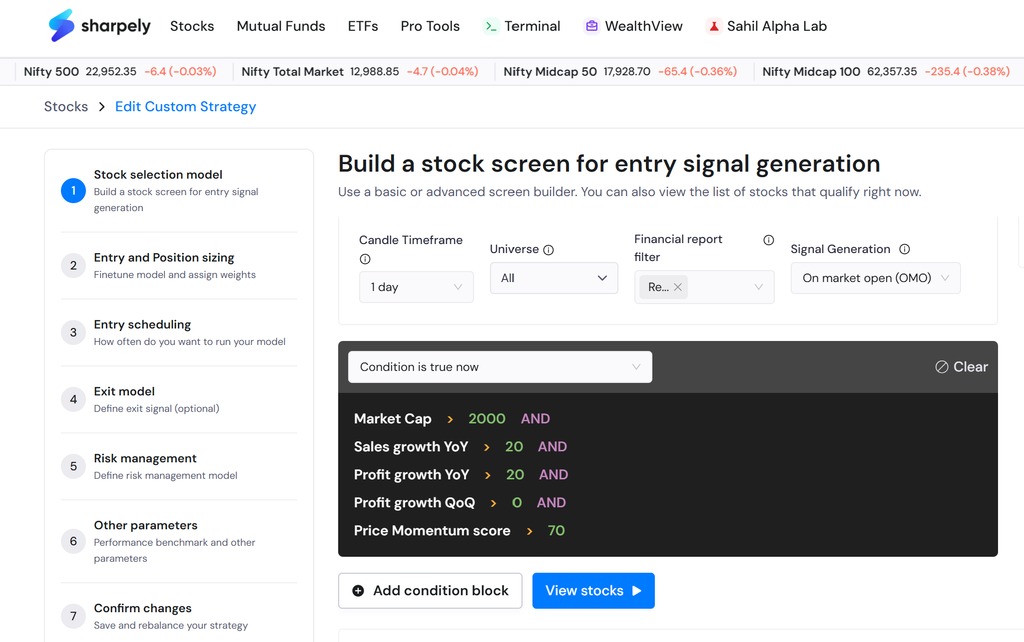
Using a stock screener: your entry conditions are the same conditions you would set in the Super Screener: technical, fundamental, or a combination. For example: Market Cap > ₹1,000 crore AND Sales growth YoY > 20% AND Close > 200 DMA. Stocks that pass these conditions enter the portfolio on each rebalancing date. Stocks that no longer pass them exit during rebalancing.
Using a factor model: instead of defining individual conditions, you select a factor score: QVM, QVMG, or a custom model you have built, and the strategy selects stocks ranked highest on that composite score. This is a more quantitative approach where the score itself encapsulates the multi-factor logic.
For a static basket, you simply define the list of stocks and their weights directly; the selection model is your own judgment rather than systematic rules.
Step 2: Position Sizing
Once the selection model determines which stocks are in, position sizing determines how much capital goes to each one. sharpely offers two weight methods:
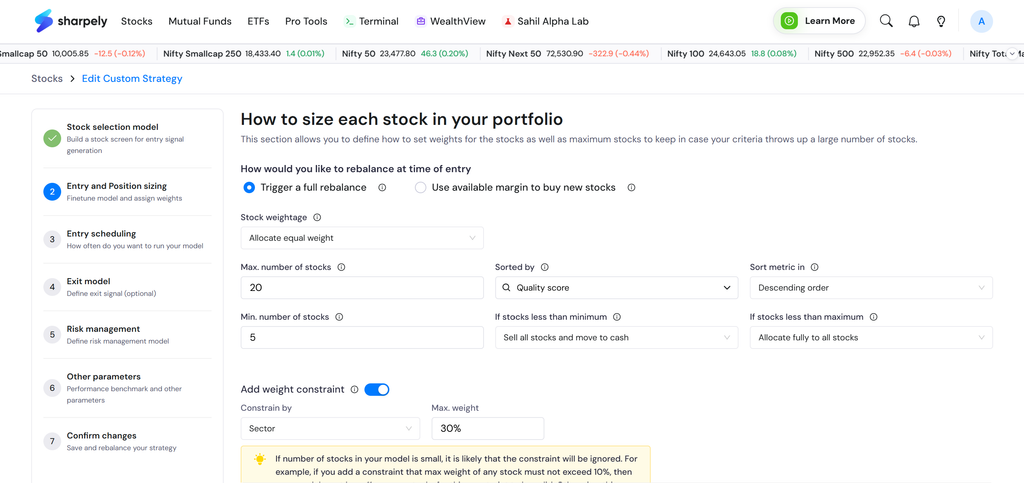
Equal weight: every stock in the portfolio gets the same allocation. If you hold 20 stocks, each gets 5% of the portfolio. Simple, avoids concentration, and tends to give more weight to smaller companies relative to market-cap weighting.
Weight by metric: allocate capital in proportion to a chosen metric, typically market capitalisation, but any available metric can be used. Market-cap weighting means larger companies get larger allocations, which may reduce the small-cap bias in the portfolio.
Beyond the weight method, you define three additional parameters:
Maximum stocks: If 65 stocks pass your screener conditions, you probably do not want to hold all 65. You set a maximum, say 25, and define which 25 to keep: the top 25 by 1-month return, or by lowest PE, or by any metric you choose. The sort metric determines which stocks from the qualified pool actually enter the portfolio.
Minimum stocks: What happens if the screener returns fewer than 20 stocks during a market downturn? You set a minimum threshold. If the number of qualified stocks falls below this minimum, the strategy exits all positions and holds cash until conditions recover. If the number is between the minimum and maximum, only the stocks that qualify are held, and the remaining capital sits in cash.
Concentration limits: you can cap the maximum exposure to any single sector, for example, limiting any single sector to 30% of the portfolio. This prevents the screener from producing a portfolio that is effectively a pure-sector bet, reducing concentration risk automatically.
Step 3: Entry and Rebalancing Schedule
Rebalancing is what keeps a dynamic strategy aligned with its rules over time. Two things drift without rebalancing: the weights of stocks change as prices move, and the underlying qualifying stocks change as market and fundamental data evolve.
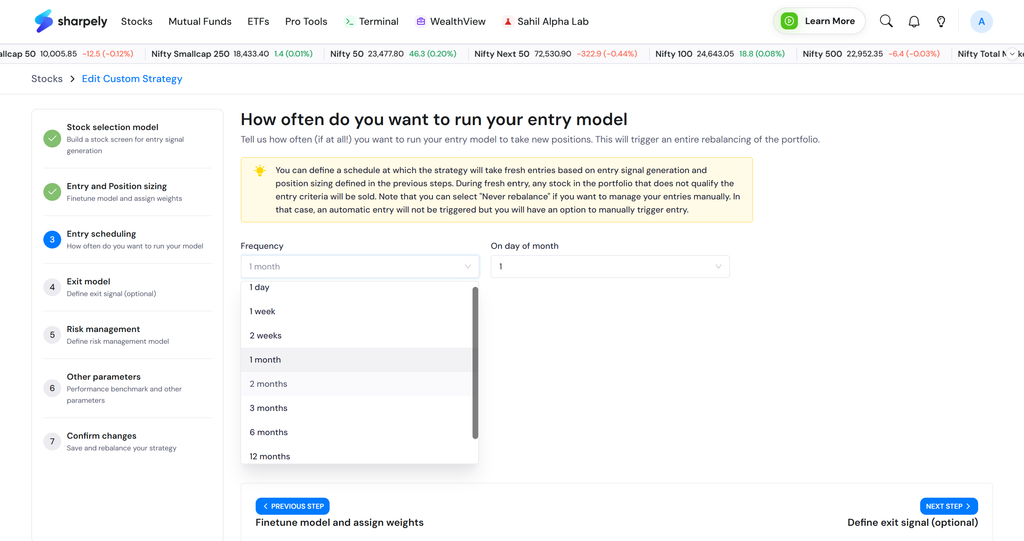
sharpely supports rebalancing frequencies from weekly to annual, plus a never-rebalance option for investors who want to track a basket without any automatic changes. The right frequency depends on your strategy’s signal:
Momentum strategies need more frequent rebalancing, monthly or quarterly, because the momentum signal decays relatively quickly. A stock that was in the top decile of 6-month returns in January may no longer qualify by April.
Value and quality strategies can rebalance less frequently, quarterly or semi-annually, because fundamental data changes more slowly and the signal decay is less severe. Rebalancing too frequently in a fundamental strategy increases turnover and transaction costs without proportionate benefit.
Once you select the frequency, sharpely asks you to specify the exact day — which day of the week for weekly, which date for monthly, which months and date for quarterly. This gives you precise control over execution timing.
Step 4: Exit Model
The exit model is a feature that separates sharpely’s strategy builder from most other platforms. It allows you to define separate, independent exit conditions that are different from — and checked more frequently than- your entry conditions.
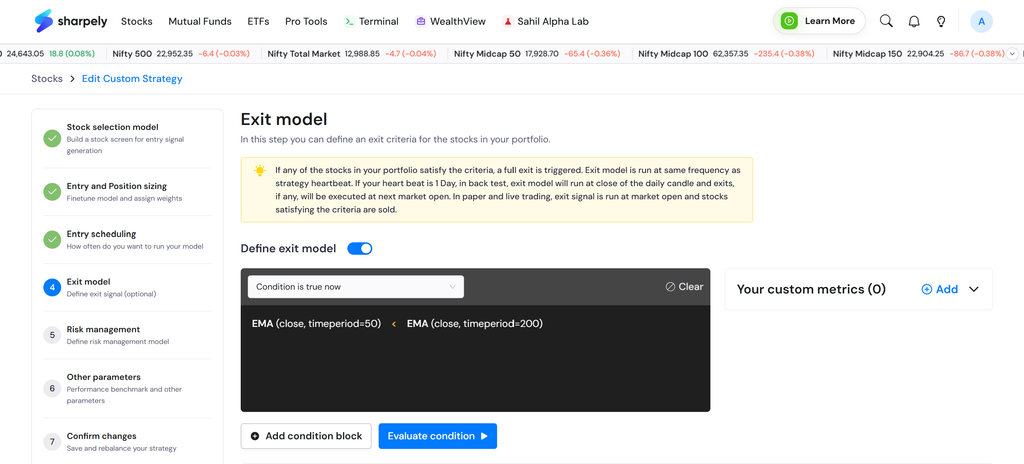
Without an exit model, the only ways a stock leaves the portfolio are: (a) it no longer passes the entry conditions on the next rebalancing date, or (b) a stop-loss is hit. The exit model adds a third option: rule-based exit at any time between rebalancing dates.
For example, your entry conditions might be fundamental: ROE > 15%, Debt/Equity < 0.5, PE < 40. But your exit conditions might be technical: exit if the stock falls below its 21-day EMA. This is a ‘technofunda’ strategy design: buy based on fundamentals, sell based on technical deterioration. This combination is now possible on sharpely in a single, integrated strategy.
Exit conditions use the same condition builder as the screener — you can combine any technical and fundamental conditions, create custom metrics, and evaluate the current list of portfolio stocks that are triggering your exit rules at any time.
Step 5: Risk Management
Risk management in sharpely operates at the position level, not the order level. This is an important distinction. Rather than setting a stop-loss on each individual trade, sharpely maintains an internal trigger based on the average entry price across all your purchases of a stock. This is more realistic for a portfolio strategy where a stock might be bought at different times and different prices across rebalancing cycles.
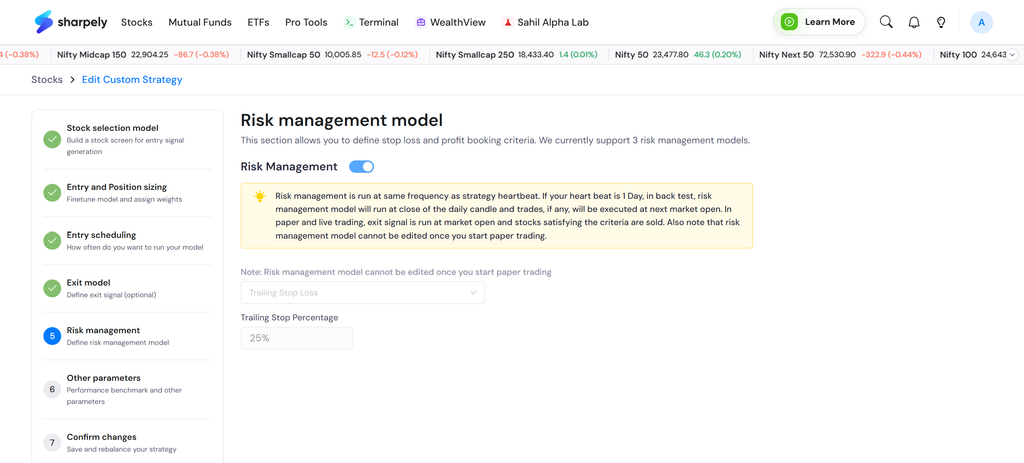
Three risk management models are supported:
Trailing Stop Loss: the stop-loss level rises with the stock price but never falls. If you set a 20% trailing stop and buy at ₹100, the stop is at ₹80. If the stock rises to ₹150, the stop rises to ₹120 and stays there even if the stock subsequently falls. This lets winners run while limiting the downside.
Fixed Stop with Drawdown Protection: a fixed stop-loss below the entry price, which only converts to a trailing stop once the stock has risen above a defined threshold. For example: fixed stop at 10% below entry price; once the stock is 20% above entry, a trailing stop of 10% kicks in. This protects capital on the downside while allowing the trailing mechanism to capture extended upside.
Fixed Stop and Take Profit: the simplest model, a defined stop-loss percentage and a defined take-profit percentage. If the stock drops by the stop-loss amount, exit. If it rises by the take-profit amount, also exit. Neither trigger moves with price. Useful for strategies with defined risk-reward objectives per trade.
Step 6: Other Parameters — Benchmark and Transaction Costs
Two final settings complete the strategy before backtesting.
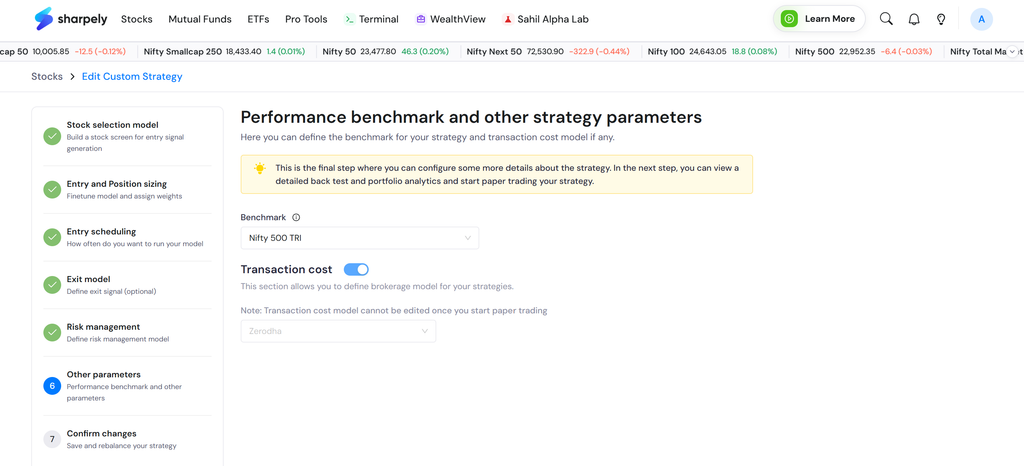
Benchmark: select the index against which your strategy will be compared in the backtest and in live performance tracking. Choose a benchmark appropriate to your universe — Nifty 50 for large-cap strategies, Nifty 500 for broader strategies, Nifty Midcap 150 for mid-cap strategies. A strategy that does not beat its relevant benchmark is one you should reconsider.
Transaction costs: sharpely includes a transaction cost model based on Zerodha’s fee structure, or you can input custom costs — either a fixed rupee amount per trade or a fixed percentage per trade. Including realistic transaction costs in the backtest is essential for strategies with high rebalancing frequency, where costs can meaningfully reduce net returns. The cost model shows you exactly what the strategy would have returned after costs — a more honest and useful figure than pre-cost returns.
From Parameters to Performance: Backtest and Paper Trade
Once all parameters are set, sharpely generates a virtual order list for paper trading, the exact set of buy and sell transactions that the strategy would execute based on its current rules and the live market data. This is what the strategy would tell you to do today if you took it live.
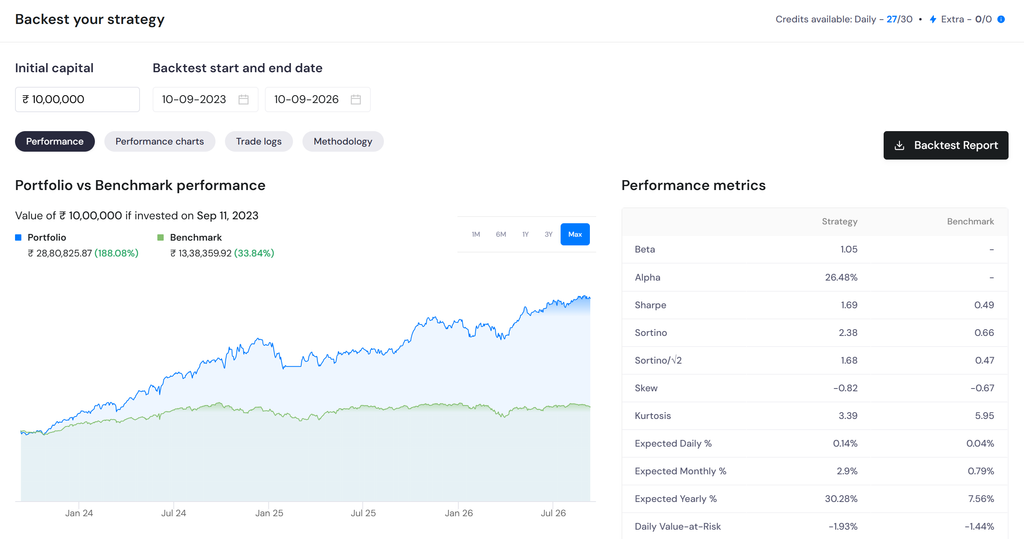
Alongside this, the backtest engine runs the same strategy against historical data and produces the full performance report: cumulative return vs benchmark, CAGR, volatility, Sharpe Ratio, maximum drawdown, calendar year returns, trade statistics, and the complete risk analytics discussed in our backtesting guide.
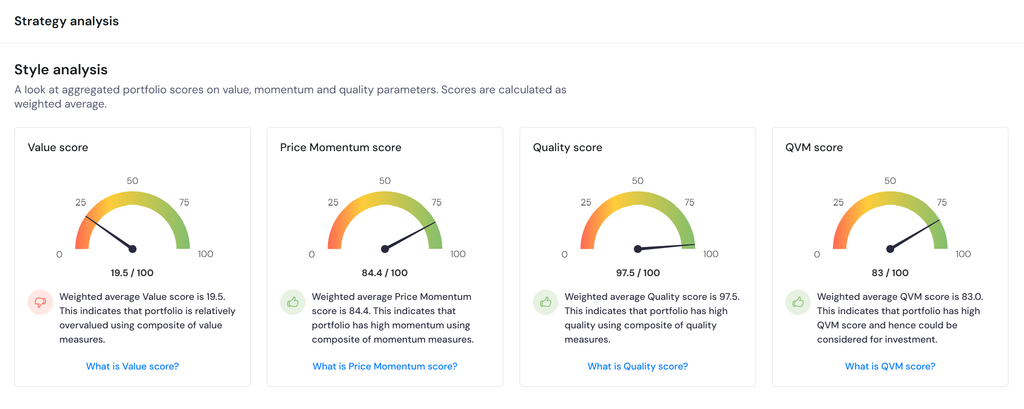
A notable addition in the backtest output is Portfolio Analytics (check the image below), a section showing the factor exposure of the strategy’s current holdings (style analysis), the sector and industry allocation, key positives and negatives of the portfolio, and a detailed view of every current holding with access to 400+ metrics per stock. This is the analysis layer that contextualises the backtest numbers with the underlying portfolio fundamentals.
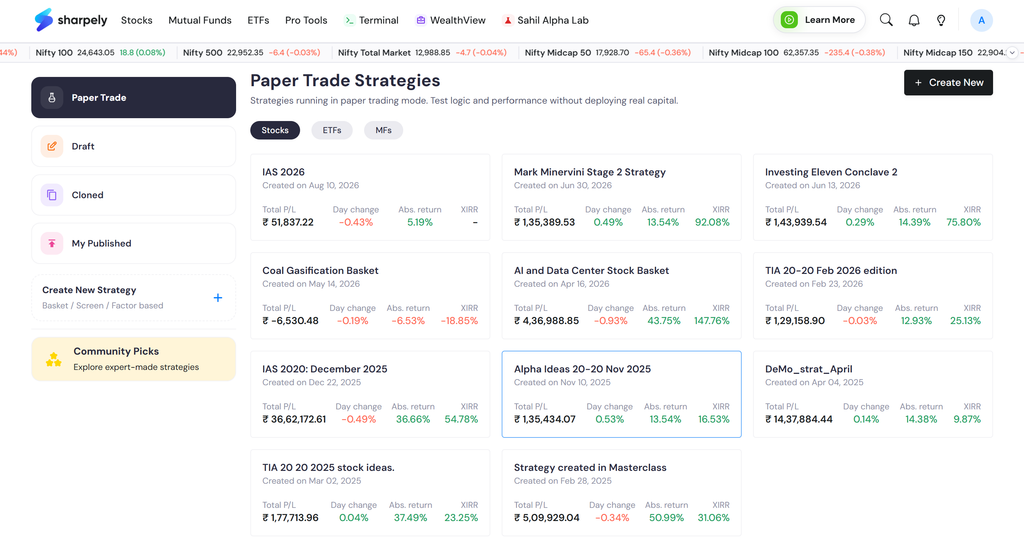
Once the backtest looks satisfactory, the strategy enters paper trading mode (check the image below again), a live simulation without real money. sharpely requires a paper trading phase before any strategy can be taken to live execution. The paper trade tracks actual performance in real market conditions, which often reveals execution dynamics that the backtest’s historical simulation cannot capture. Treat the paper trade as a mandatory quality gate, not a formality.
Strategy Building Checklist
| Step | Decision | Key Question to Answer |
| 1. Selection Model | Screener conditions, Factor Model, or Static basket | Why should these specific stocks/instruments outperform? |
| 2. Position Sizing | Equal weight or metric-based. Max/min stocks. Sector cap. | How much goes in each stock? What happens if few qualify? |
| 3. Rebalancing Schedule | Weekly / monthly / quarterly / annual / never | How quickly does your signal decay? What turnover is acceptable? |
| 4. Exit Model | Rule-based exit conditions (optional) | Are my exit conditions different from my entry conditions? |
| 5. Risk Management | Trailing SL / Fixed + Drawdown Protection / Fixed SL + TP | What is the maximum loss I am willing to absorb per position? |
| 6. Benchmark | Choose relevant index | What am I trying to beat? Am I comparing apples to apples? |
| 7. Transaction Costs | Zerodha model or custom | What will this strategy actually return after all costs? |
| 8. Backtest | Run historical analysis | Does the strategy produce meaningful risk-adjusted outperformance? |
| 9. Paper Trade | Simulate for defined period | How does the strategy behave in real market conditions? |
| 10. Go Live | Execute orders manually | Am I confident enough in this strategy to deploy real capital? |
Key Takeaways
A rule-based strategy is defined by five components, not one. Selection model, position sizing, rebalancing schedule, exit conditions, and risk management together form a complete system. A stock selection idea without the rest is not a strategy.
The selection model is the engine, but the parameters are what make it robust. An excellent screener that is rebalanced too frequently, over-concentrated in one sector, or missing a stop-loss mechanism will underperform its potential. Every parameter matters.
The exit model enables technofunda strategies. Being able to define separate entry conditions (fundamental) and exit conditions (technical) in the same strategy opens a design space that most retail investors have never had access to.
Risk management operates at position level, not order level. This is the correct approach for a portfolio strategy; stop-losses track the average entry price across all purchases of a stock, not just the most recent trade.
Paper trade before going live, always. The backtest shows historical performance. The paper trade shows real-world performance. Neither guarantees future results, but the paper trade is significantly more diagnostic than the backtest for identifying execution gaps.
Strategy signals generate orders; execution is yours. On rebalancing day, the strategy tells you exactly what to buy and sell. You review and execute those orders manually. The strategy provides the systematic signal; the execution stays in your hands.
Start building on sharpely’s Strategy Builder.