In the last two articles, we explored the basics of screening stocks and creating strategies with sharpely’s Basic and Advance Builder.
But let’s face it—creating a screen is just the beginning. How do you know it’s built to succeed? That’s where our advanced backtesting comes in.
In sharpely, you can measure performance, tweak parameters, and fine-tune your screens using data and analysis. Let’s see how you can use it to uncover winning screens.
You'll spot the Backtest button on both the Basic and Advance Builders (as shown in the image below). We’ll continue with the sample screen we built earlier for this guide.

Once you click the backtest button, you will see a panel where you have to select the backtest parameters.
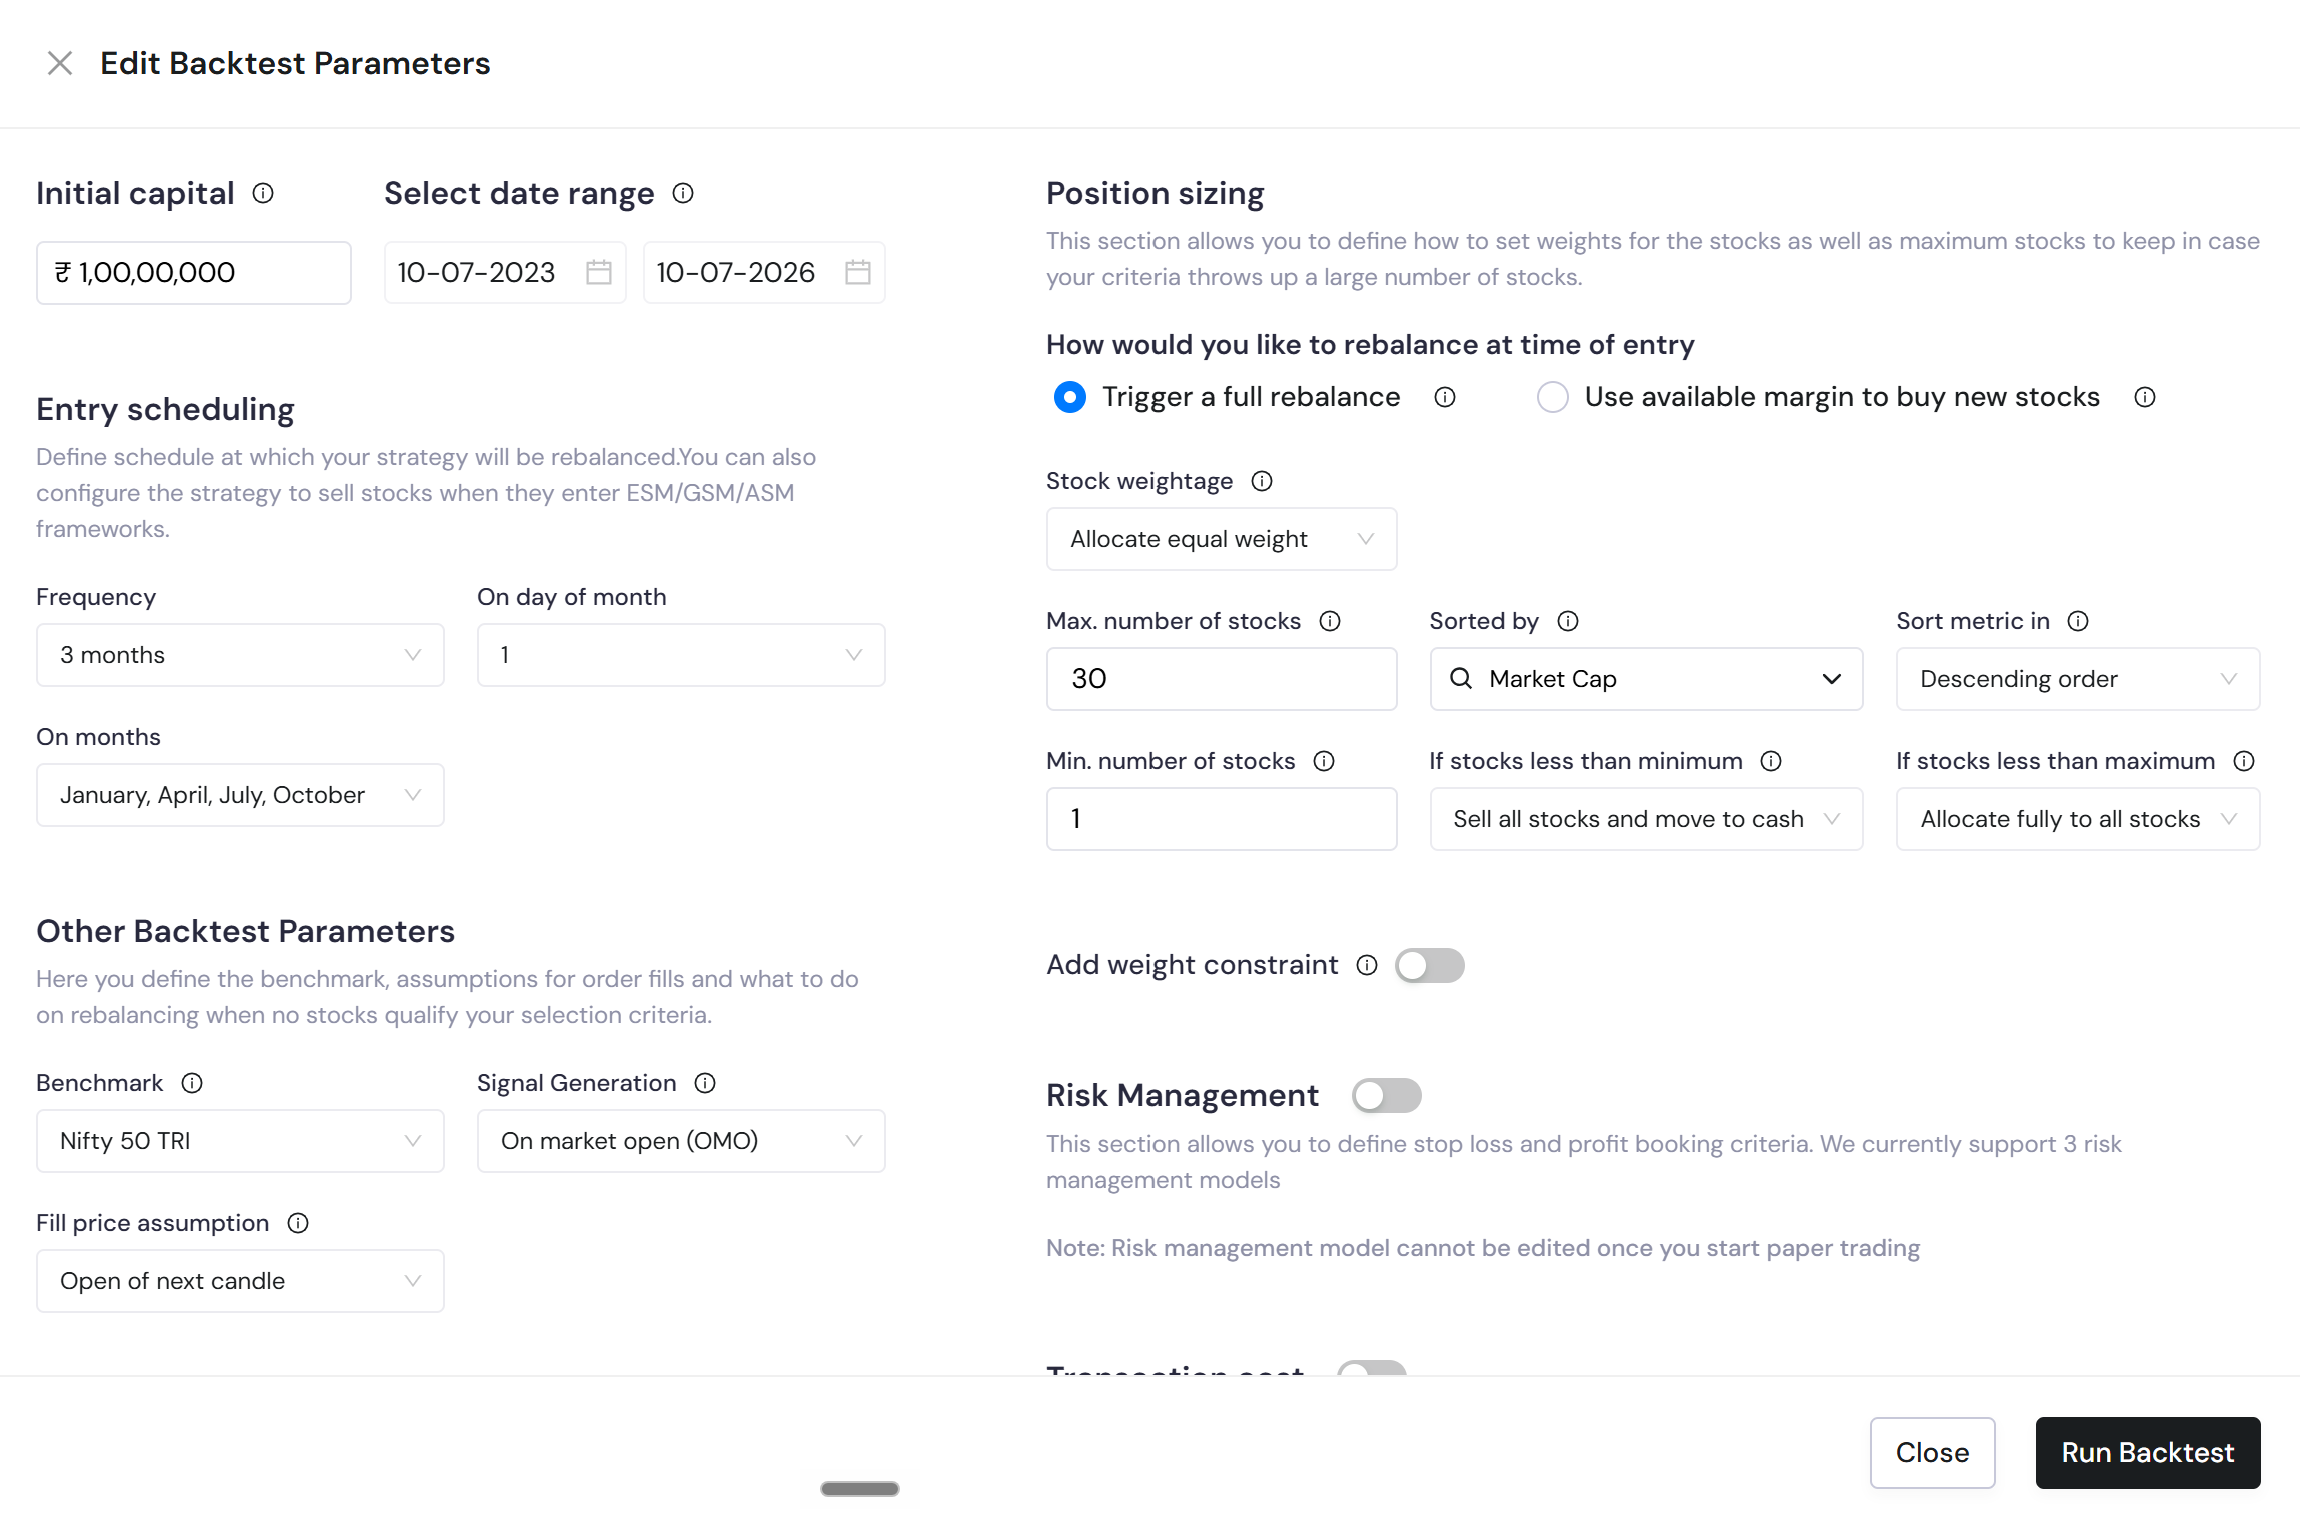
Once you select them and hit on the run backtest button, you will see the result. There are different tabs here. Let's look at them in detail
Performance
This is where you get a bird’s eye view into how your strategy performs in the stock market.
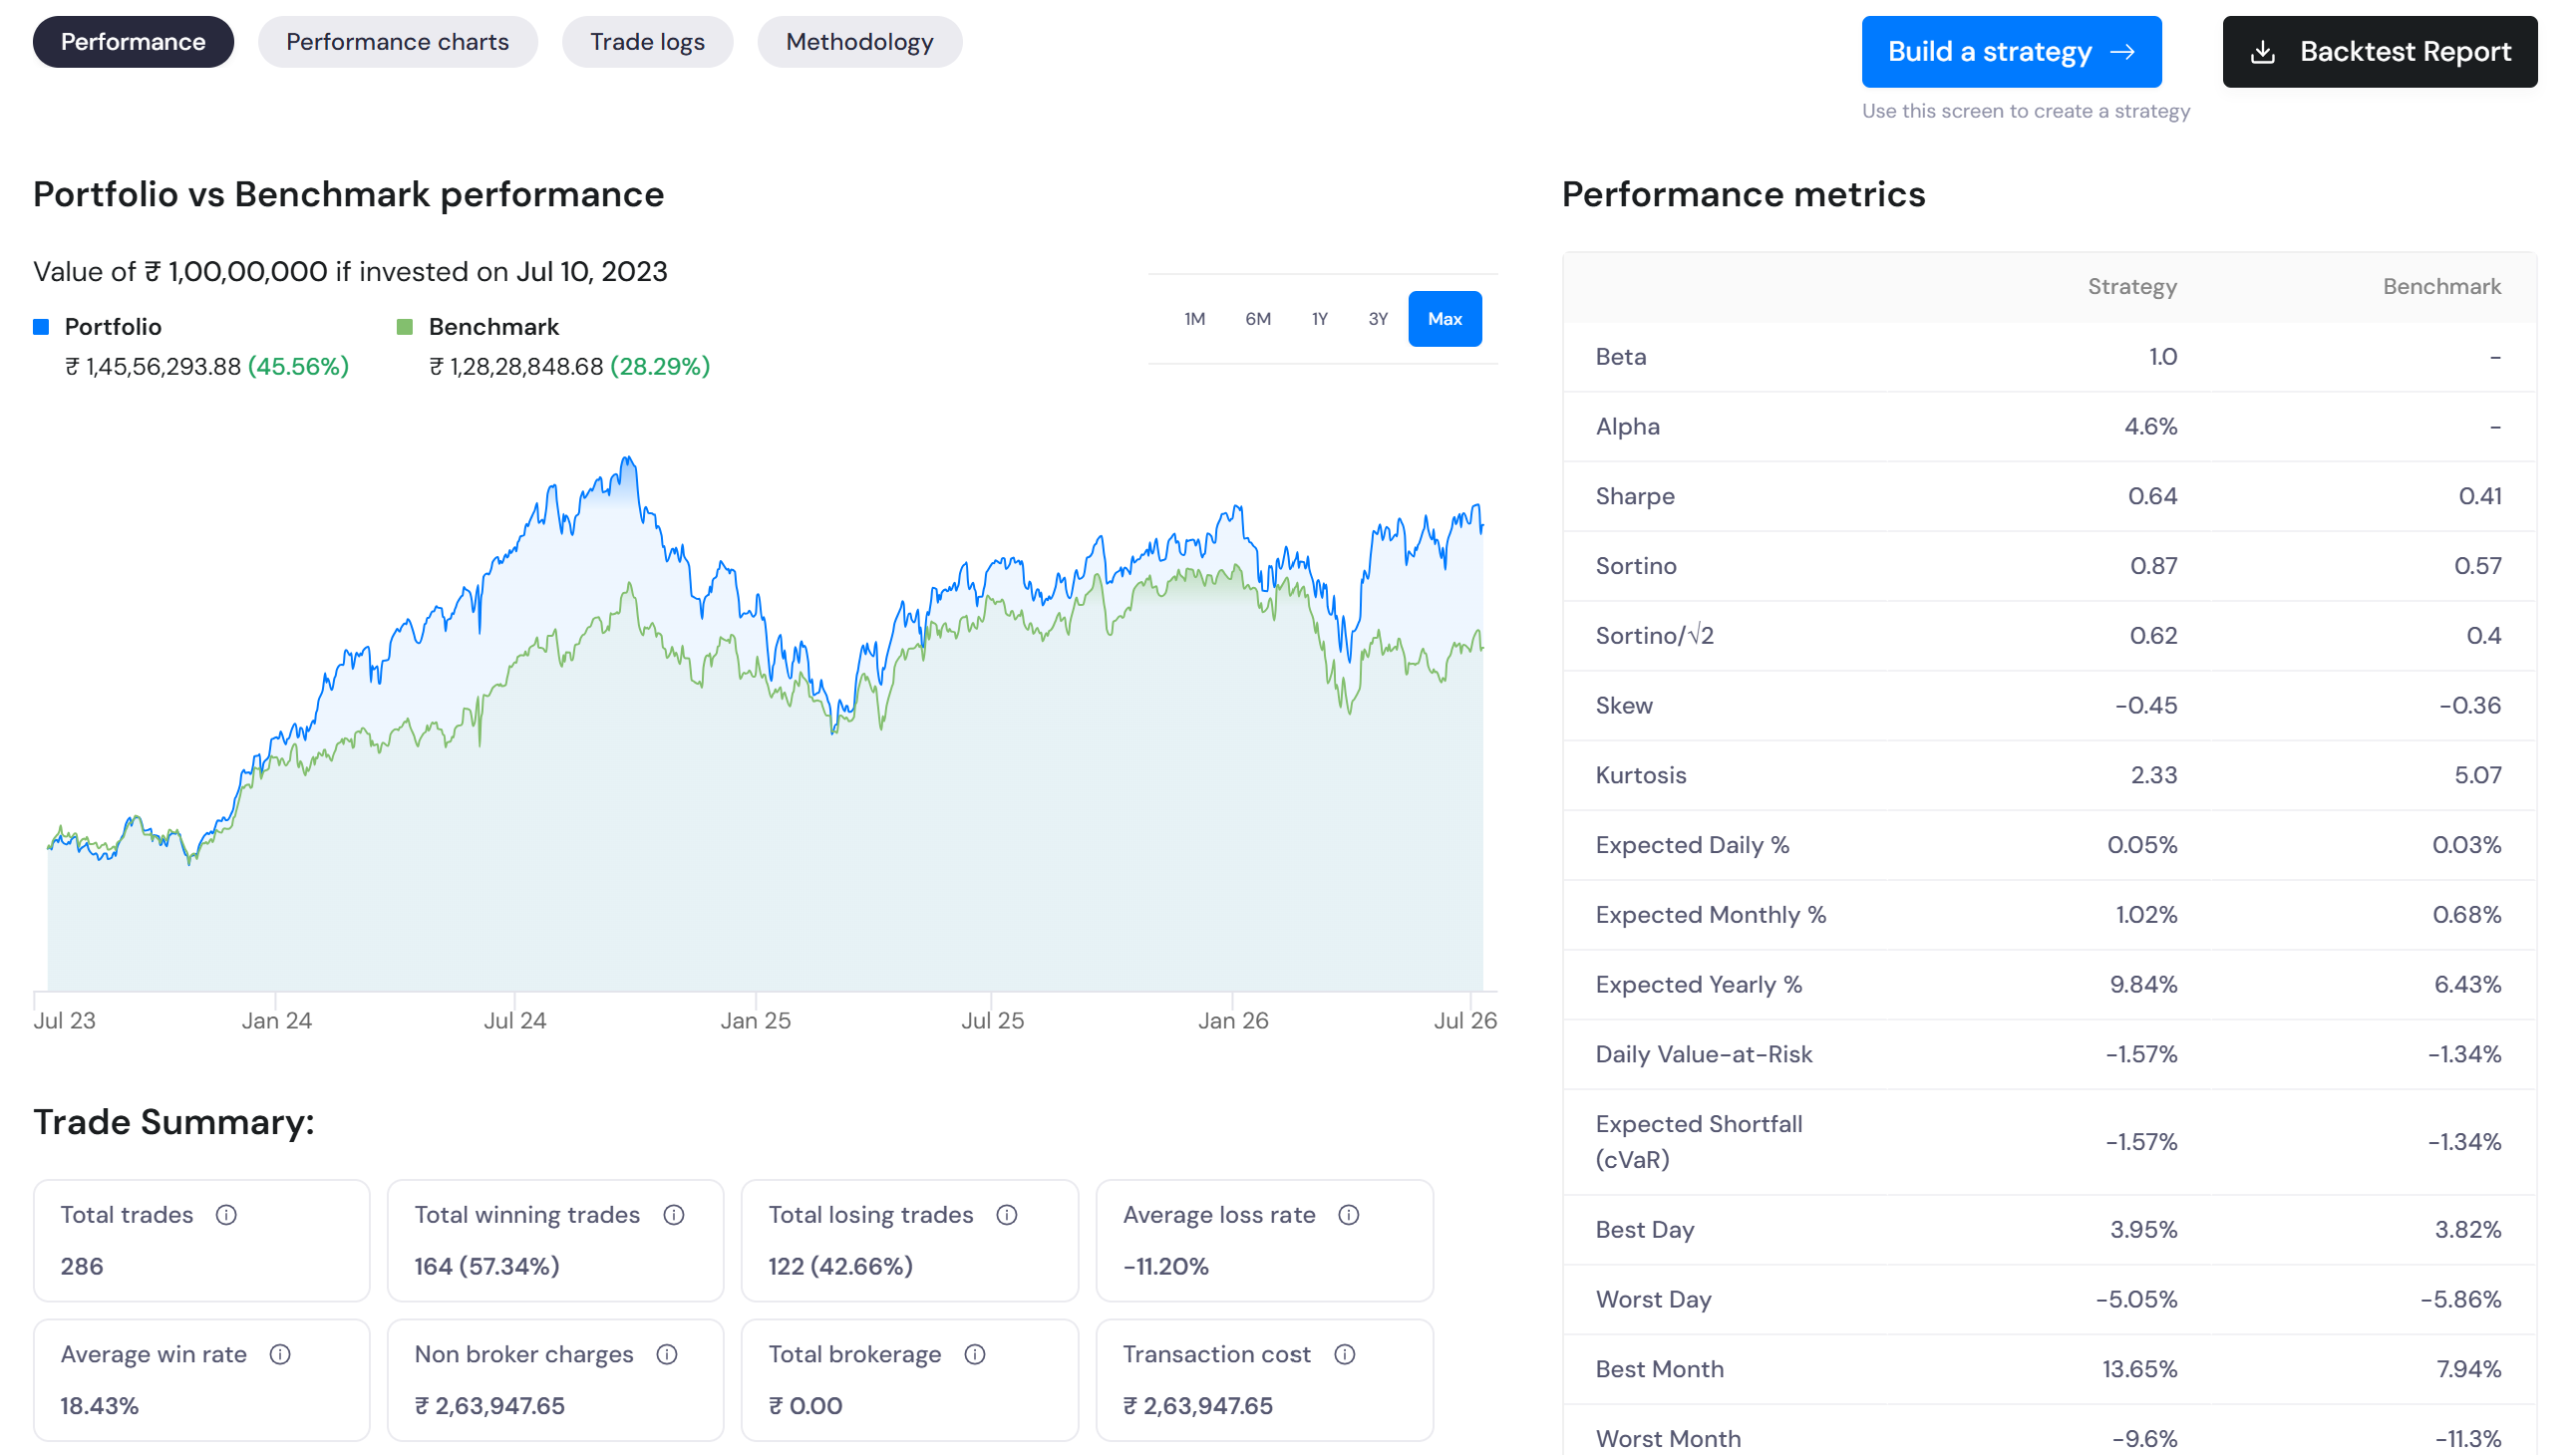
Portfolio v/s Benchmark Chart
This is a visual powerhouse—it plots your screen’s returns against the benchmark over different time frames.
You can compare your screen’s performance against a benchmark of your choice. You can even switch benchmarks using the Strategy Parameters section.
And there’s more. Want to analyze short-term gains? Toggle the timeframe. Curious about returns over a longer duration? Extend it. The insights are endless.

.
Performance metrics
This section is like the ultimate scorecard for your strategy. It includes key metrics like alpha, beta, Sharpe ratio, % win rate, drawdowns, and many more. You can scroll through the whole section and understand the strengths and weaknesses of your screen.

Trade summary
This section is like a comprehensive snapshot of how your strategy holds up under real-world conditions. Numbers come alive here letting you analyze data points like the worst 5 drawdowns, trailing returns, calendar returns, and much more.
[Note: This report is generated based on preset parameters. You have the option to change it as per your needs.]

Performance charts
Here’s where things get granular. A lethal combination of intuitive charts and important data points– this gives you valuable insights in an easy-to-understand manner. Starting with:
Distribution of monthly returns

Monthly returns heatmap
You can get a quick glance into how your trades fair across different months and spot any common trends with ease.
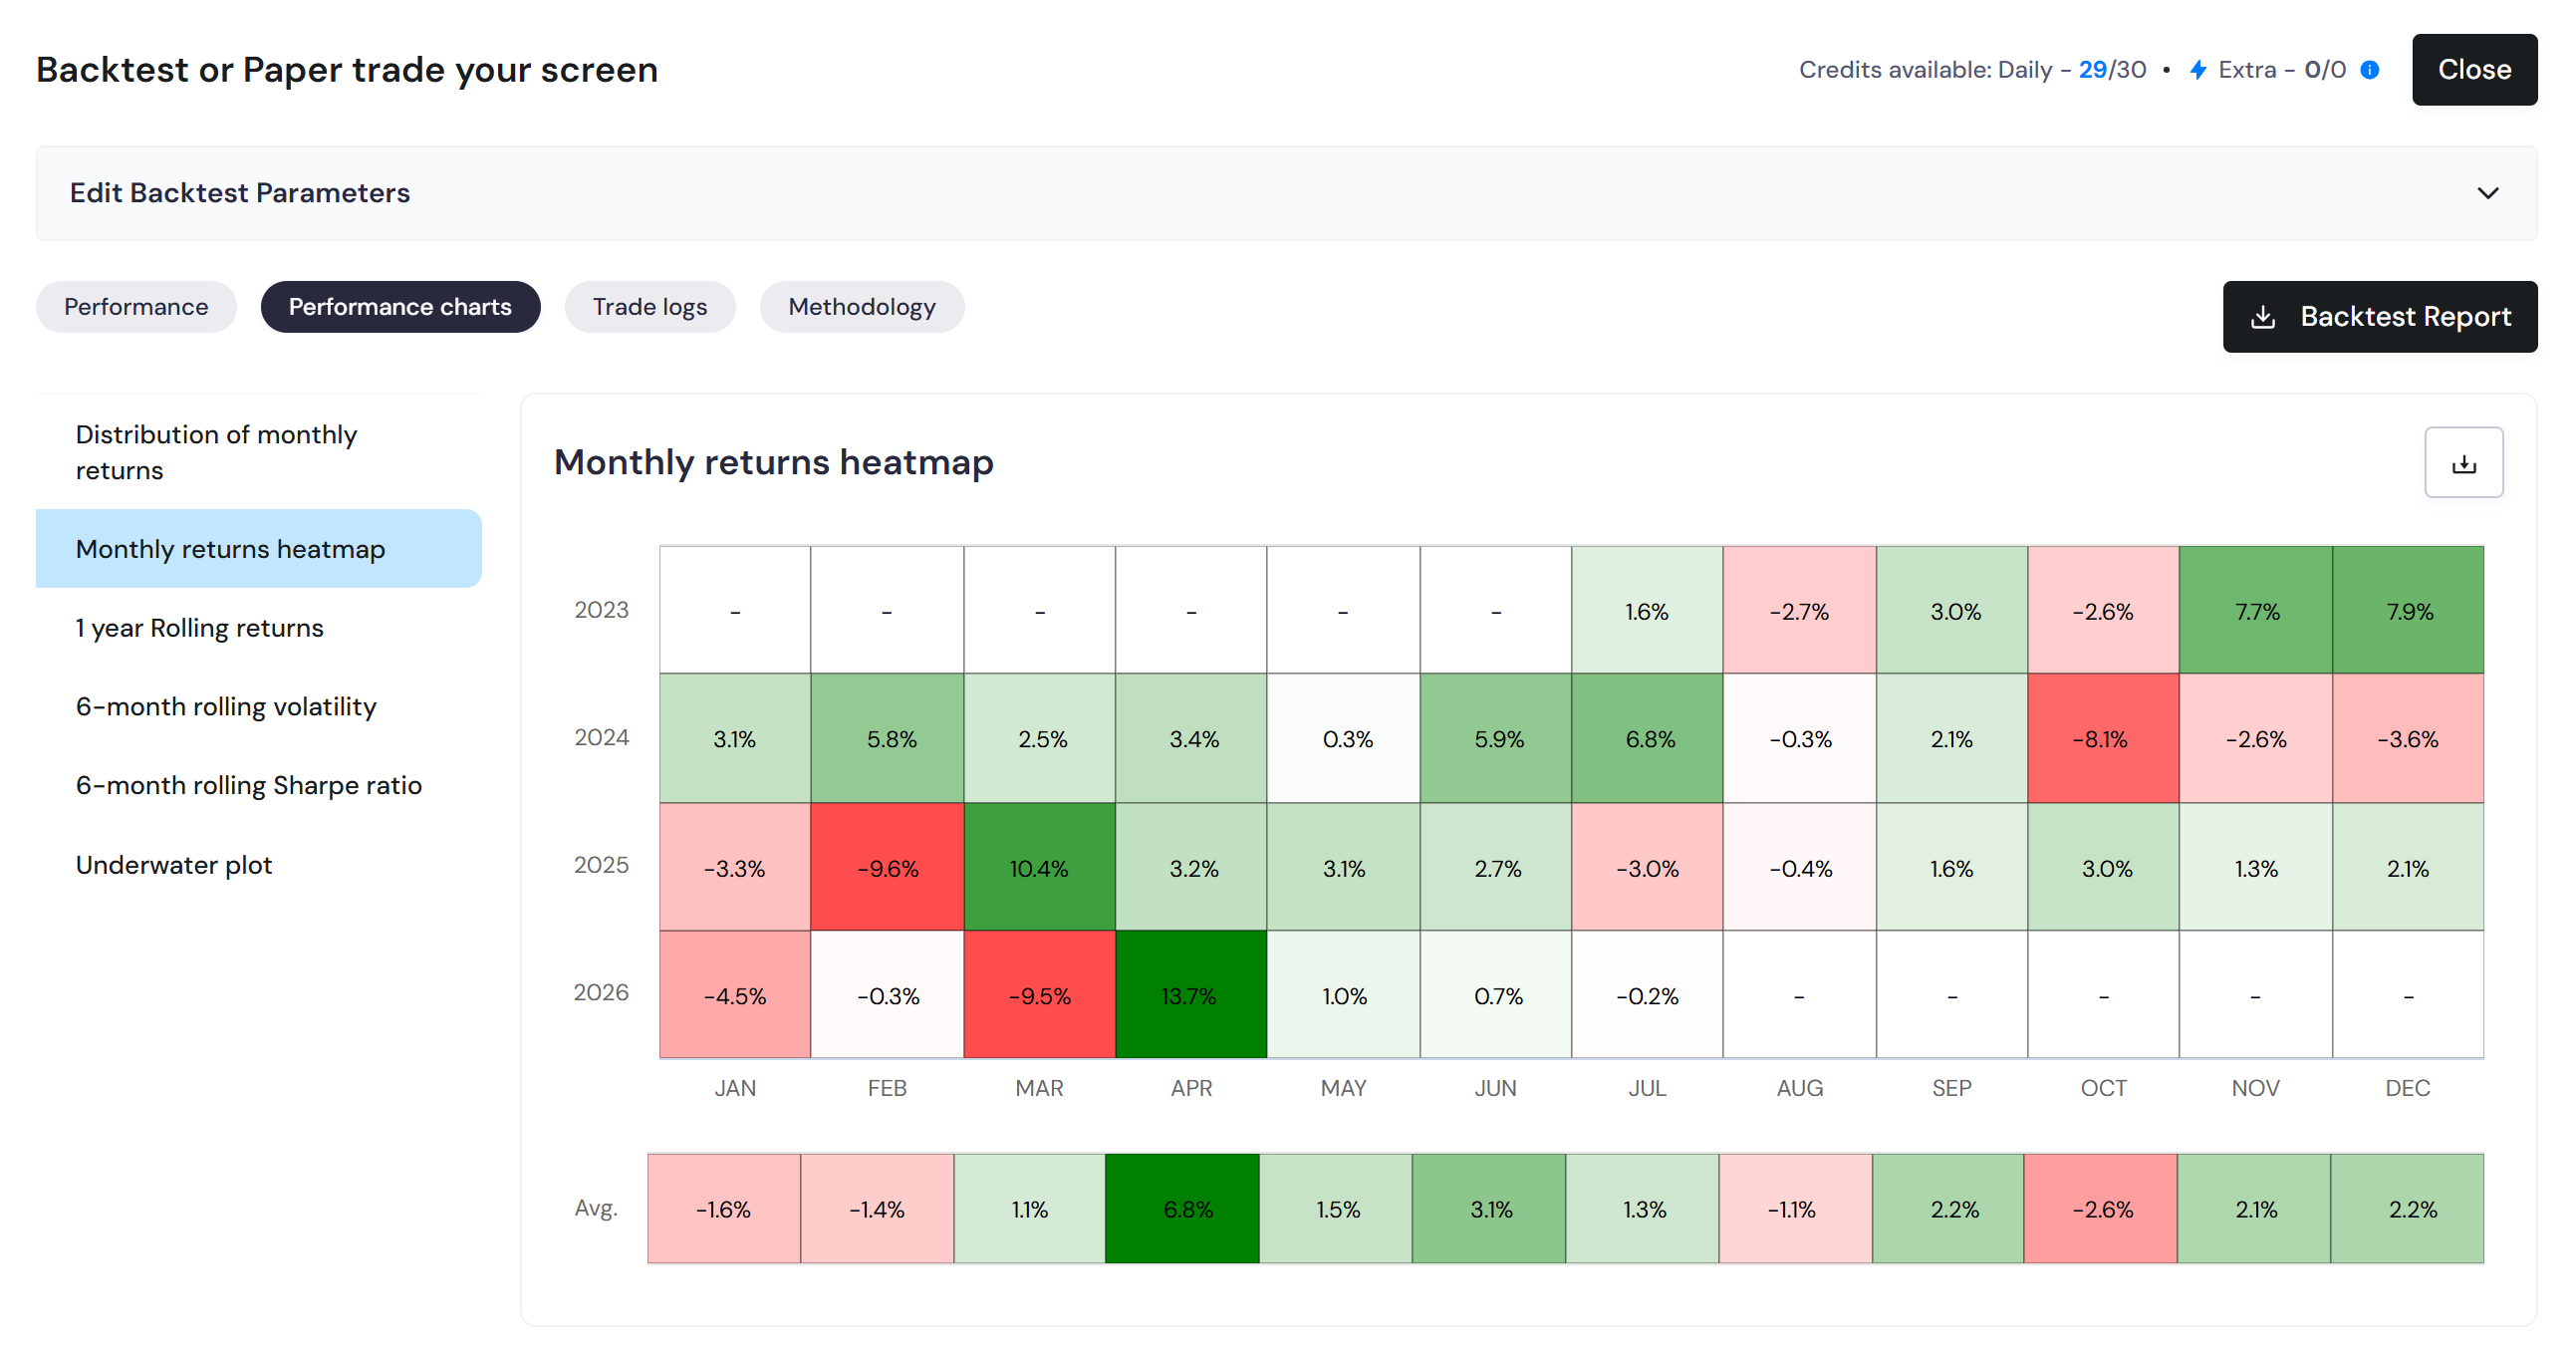
The performance charts also give you an insight into the 1-year rolling returns.
1-Year Rolling Returns
It includes the selected benchmark to offer a deeper insight into how your strategy performed over the period.
You can spot periods where your portfolio consistently outperformed or underperformed the benchmark. This is a great way to evaluate if your strategy can consistently beat the benchmark returns.

Similarly, you can select and understand the other things in the performance charts. Moving on to the Trade Logs now.
Trade logs
The Trade Logs tab gives you a detailed report based on your rebalancing frequency and risk management settings.
From fill price to order quantity, every detail is logged. And here’s the best part: you can export these logs into Excel for further analysis.

The other two sections— Analysis and Methodology are more focused on your backtesting strategy giving details into how we run backtest on sharpely, how we avoid behavioral biases, and more such info. You can browse through them by clicking on the specific section.
Apart from this, we’ve launched another cool feature. You now have the option to download your backtest report.
That’s about it for this article. As discussed before you have the option to edit the parameters according to your needs. To do that, simply click on the dropdown arrow as highlighted in the red box above.
If you liked this article, we’re sure the last few ones will make you go ga ga for our screen builders. Tap on the next article now!