

Getting Started
Ready to begin your journey at sharpely? In this article, we’ll look into the basic overview of our Terminal.
Here’s what you’ll learn
✅The fundamental components of our Terminal.
✅How to navigate your way around it.
✅Basic idea about different features on our Terminal.
✅How to set it up in a way that fits your style
In sharpely, we offer a highly intuitive and customizable Terminal that fits different investors' styles— whether you’re into stocks, mutual funds, or ETFs, we've got you covered.
It provides a single view of all key inputs needed for making an informed decision. This helps you stay on top of market movements, stock updates, or other variables affecting your strategy.
As you can see in the image below, the Terminal is divided into two parts: My Dashboards & My Charts
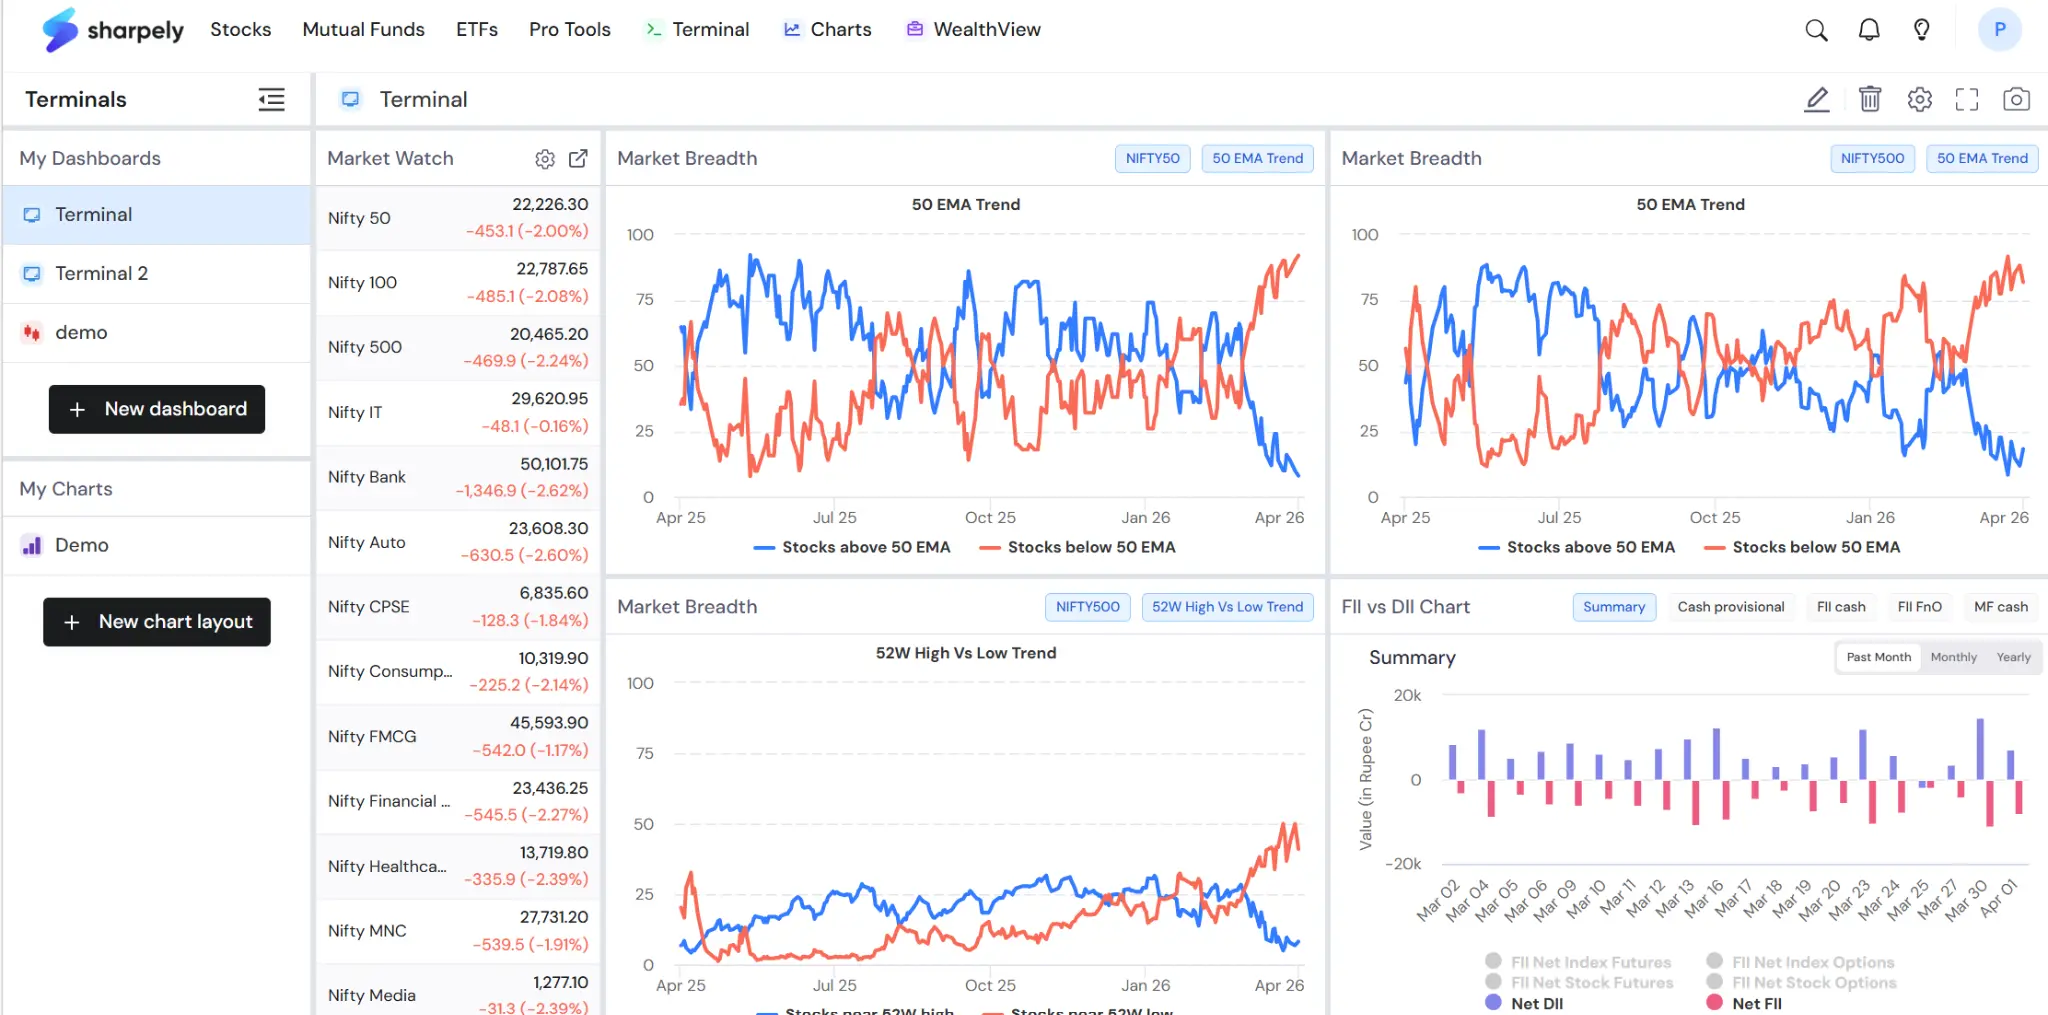
Let’s start with the Dashboards.
To begin,
Click on ‘New Dashboard’

A box will open, assign a name, and click on ‘Done.’

You can create it in two ways:
1) Choose a pre-built one.
2) Build one from scratch

In the above image, you can see the current pre-built options available on sharpely. Pick & choose one that fits your investing style & that’s it… You’re set!
Let us show you an example. We will pick ‘Trend Analyst.’

As we can see,
The dashboard covers key data points that one needs to access when they are trying to gauge the trend.
To change the index or metric, simply click on the existing metric and you will get the options like this:

In our next article,
We will see how to build a dashboard from scratch.