
Most investors evaluate mutual funds the same way: check the 1-year, 3-year, and 5-year CAGR, compare it to a few peers, and move on to purchase. It is just a reasonable starting point. And it is also an incomplete one.
CAGR (Compound Annual Growth Rate) is a point-to-point number. It tells you the annualised return between two fixed dates. What it cannot tell you is whether that return was earned consistently or in a single lucky year. It cannot tell you how much risk was taken to earn it. It cannot tell you whether adding this fund to your portfolio actually reduces risk or simply adds more of the same exposure you already have.
Serious mutual fund analysis requires a broader set of metrics, ones that reveal fund quality, manager skill, risk-adjusted performance, and portfolio-level efficiency simultaneously. This article covers the seven metrics that do exactly that, explains what each one means, how to interpret it, and what a good versus poor reading looks like in practice.
Metric 1: Rolling Return Beat Percentage vs Category Average
If there is one metric that deserves to replace point-to-point CAGR as the default evaluation tool for mutual funds, it is rolling returns, and specifically, the rolling return beat percentage versus the category average.
What It Is
Rolling returns measure a fund’s annualised return for every possible holding period of a fixed length within a historical window. For example, 3-year rolling returns on a 10-year dataset calculate the annualised return for every 3-year period starting on each day or month within that window — producing hundreds of data points rather than one. Check the numbers for Parag Parikh Flexi Cap Fund below as an example.
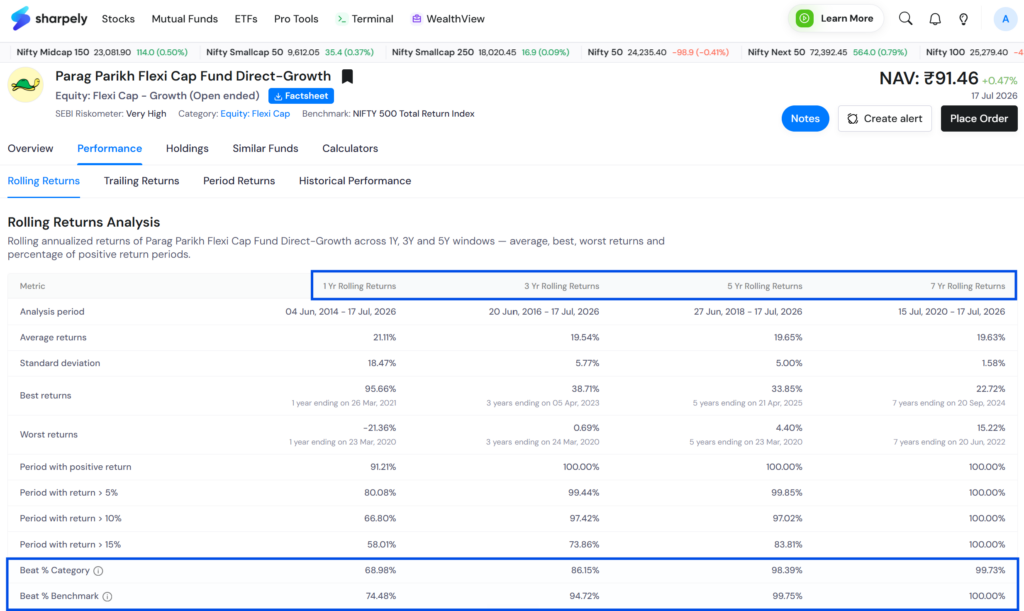
The beat percentage answers a specific question: in what percentage of those rolling periods did the fund outperform its category average? A fund with an 80% rolling return beat rate has outperformed its category peers in 8 out of every 10 three-year windows. A fund with a 40% beat rate has underperformed more often than it has outperformed, regardless of what its 5-year CAGR says.
Why It Matters
If you invest via SIP, your entry point is not the single start date used in a CAGR calculation. You are entering at different points across market cycles. What you actually care about is how the fund has performed across many different starting points, which is exactly what rolling returns measure.
Two funds can show identical 5-year CAGR while one has an 80% rolling beat rate and the other has a 35% beat rate. The first is a genuinely consistent outperformer. The second had one or two exceptional years that pulled up an otherwise mediocre average. CAGR cannot tell the difference. Rolling return beat percentage can.
What to Look For
A rolling return beat percentage of 70% or above across 3-year and 5-year windows is generally considered a sign of consistent outperformance. Above 80% is strong. Below 50% means the fund underperforms its category more often than it outperforms, a meaningful red flag regardless of headline CAGR.
Metric 2: Alpha
Alpha is the most direct measure of a fund manager’s skill, or the lack of it. It answers the question: how much return did the fund generate above and beyond what its benchmark index would have delivered?
What It Is
Alpha is calculated by comparing the fund’s actual return to the return predicted by its beta (more on beta shortly) and the benchmark’s performance. A positive alpha means the fund delivered returns above what the market exposure alone would have generated. A negative alpha means the fund underperformed after accounting for its level of market exposure.
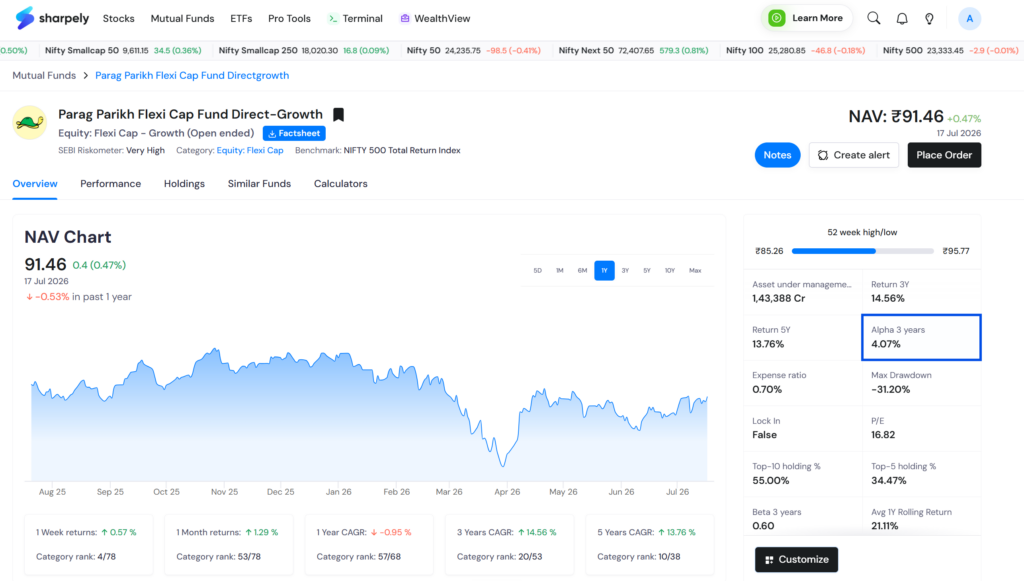
If a fund has an alpha of +3%, it generated 3 percentage points of return above what its benchmark exposure would have predicted. An alpha of –2% means the fund destroyed 2 percentage points of value relative to the benchmark after adjusting for market exposure.
Why It Matters
Alpha is the clearest answer to the question every active fund investor should ask: am I being compensated for paying an expense ratio above what a passive index fund charges?
If a fund’s alpha is consistently negative over 3 and 5 years, the fund manager is not adding value. You are paying active management fees for passive — or below-passive — results. A consistently positive alpha, on the other hand, is evidence that the manager is doing something right in stock selection or portfolio construction.
What to Look For
Positive alpha over both 3-year and 5-year periods is the benchmark. Single-year alpha can be distorted by market conditions. Multi-year positive alpha is a more reliable signal of genuine manager skill. Be cautious of funds with high alpha in one period and negative alpha in another, consistency matters here as much as it does in rolling returns. You can calculate alpha of any fund across various timeframes using our Alpha Analysis tool.
Metric 3: Sharpe Ratio
The Sharpe Ratio answers a question that raw returns cannot: how much return did the fund generate per unit of risk taken?
What It Is
The Sharpe Ratio is calculated by dividing a fund’s excess return above the risk-free rate (typically the 91-day T-bill or repo rate) by its standard deviation, a measure of how much the fund’s returns fluctuate. The result is a single number that expresses return per unit of volatility.
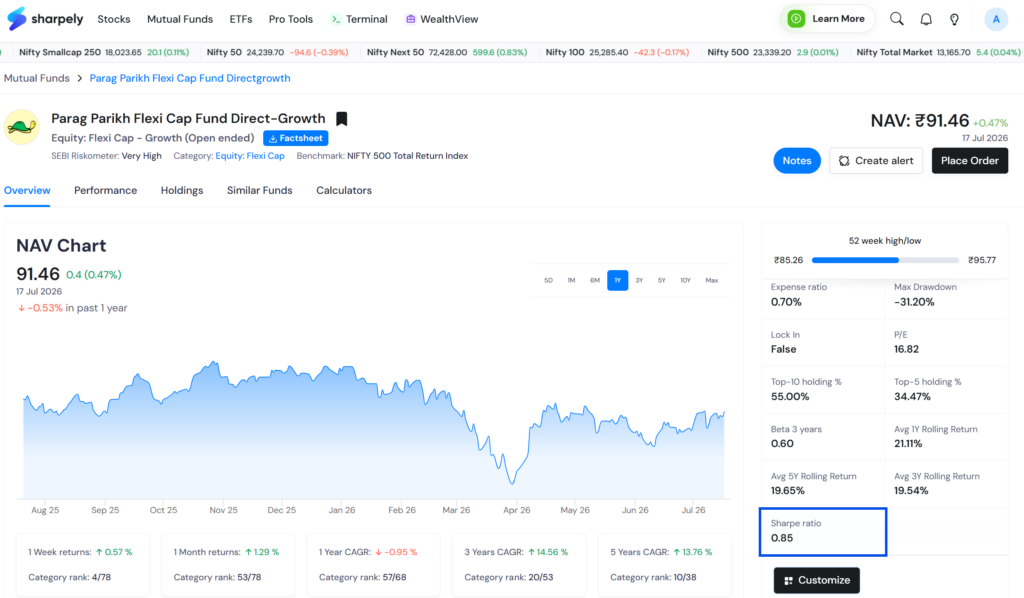
A Sharpe Ratio of 1.0 means the fund earned 1 unit of excess return for every unit of volatility. A ratio of 0.5 means it earned half a unit of return for every unit of volatility, less efficient. A ratio above 1.0 is generally considered good; above 1.5 is excellent.
Why It Matters
Two funds can show identical 5-year CAGR with very different Sharpe Ratios. Fund A earned 15% CAGR with relatively low volatility, high Sharpe. Fund B earned 15% CAGR with extreme swings along the way, requiring investors to stomach 40% drawdowns, low Sharpe. The destination was the same. The journey was not.
For most retail investors, the journey matters. A fund with a lower CAGR but a higher Sharpe Ratio may actually be the better choice, particularly for investors who invest via SIP and may be tempted to pause SIPs or redeem during periods of high volatility.
What to Look For
Compare the Sharpe Ratio within the same fund category, a small-cap fund will naturally have higher volatility than a large-cap fund, so cross-category Sharpe comparisons are not meaningful. Within a category, a fund with a consistently higher Sharpe than its peers is delivering better risk-adjusted returns. That is ultimately what you are paying for.
Metric 4: Beta
Beta measures how sensitive a fund is to market movements, specifically, how much the fund tends to move for every 1% move in its benchmark index.
What It Is
A beta of 1.0 means the fund moves in line with the benchmark. A beta of 1.2 means the fund moves 20% more than the benchmark in both directions, amplifying both gains and losses. A beta of 0.8 means the fund moves 20% less than the benchmark, more defensive, less responsive to market swings.
Why It Matters
Beta tells you something important about what you are actually buying. A fund with a beta significantly above 1.0 is a high-market-sensitivity fund, it will outperform strongly in bull markets and underperform sharply in bear markets. A fund with beta below 1.0 is more defensive, it may lag during strong bull runs but preserve capital better during corrections.
Beta is also the input to alpha. A fund with high returns but also high beta has not necessarily demonstrated skill, it may simply have taken on more market risk. Stripping out the beta contribution is how alpha separates market exposure from genuine fund manager value addition.
What to Look For
There is no universally good or bad beta, it depends on what role the fund plays in your portfolio. What matters is that you know a fund’s beta and have chosen it intentionally. Never buy a high-beta fund without understanding that it will amplify both the upside and the downside of the market cycle you are entering.
Metric 5: Standard Deviation
Standard deviation is the most direct measure of a fund’s volatility, how much its returns fluctuate around the average over time.
What It Is
A fund with a high standard deviation delivers returns that vary widely from period to period, strong in some months, weak in others, with significant swings in NAV. A fund with a low standard deviation delivers more consistent, smoother returns with less fluctuation around the average.
Why It Matters
Standard deviation is the denominator in the Sharpe Ratio calculation, so understanding it as a standalone metric helps you understand Sharpe more intuitively. But it also matters independently, particularly for investors who are sensitive to short-term drawdowns or who invest a lump sum rather than a SIP.
A fund with high standard deviation requires more investor discipline, the ability to hold through significant NAV drawdowns without redeeming at the wrong time. If your investment horizon is short or your risk tolerance is low, a high-standard-deviation fund in an otherwise promising category may not be the right fit, even if its CAGR and alpha look attractive.
What to Look For
Compare standard deviation within the same fund category. Small-cap funds will naturally have higher standard deviation than large-cap funds, that is not a flaw, it is the category’s nature. Within a category, a fund with lower standard deviation and equivalent or better CAGR and alpha than its peers is delivering a superior risk-return combination.
Metric 6: Expense Ratio
The expense ratio is the simplest metric in this list and also one of the most underappreciated. It is the annual fee charged by the fund house for managing your money, expressed as a percentage of AUM and deducted daily from the fund’s NAV.
What It Is
If a fund has an expense ratio of 1.5%, and your investment grows by 12% in absolute terms before fees, your actual return after fees is approximately 10.5%. The fund house has taken 1.5 percentage points of your return every single year, compounded.
SEBI caps expense ratios by fund category and AUM size. Typically, direct plans have significantly lower expense ratios than regular plans, often 0.5% to 1.0% lower because direct plans do not carry distributor commission. For a fund held over 10 or 15 years, this difference compounds into a material difference in final corpus.
Why It Matters
The expense ratio is the only return-reducing factor in a mutual fund that is completely certain and compounding. Market returns are uncertain. Expense ratios are guaranteed deductions. Every basis point of expense ratio you pay is a guaranteed drag on your compounded return across every year you hold the fund.
For index funds and passive ETFs, where alpha generation is not the goal, the expense ratio is often the single most important metric. Among two index funds tracking the same benchmark, the one with the lower expense ratio will almost always deliver higher net returns over time.
What to Look For
For active equity funds: compare within category. A fund with a high expense ratio needs to demonstrate consistent alpha and rolling outperformance to justify the cost. If a fund’s alpha has been near zero or negative over 5 years and its expense ratio is high, the investor is paying for performance they are not receiving.
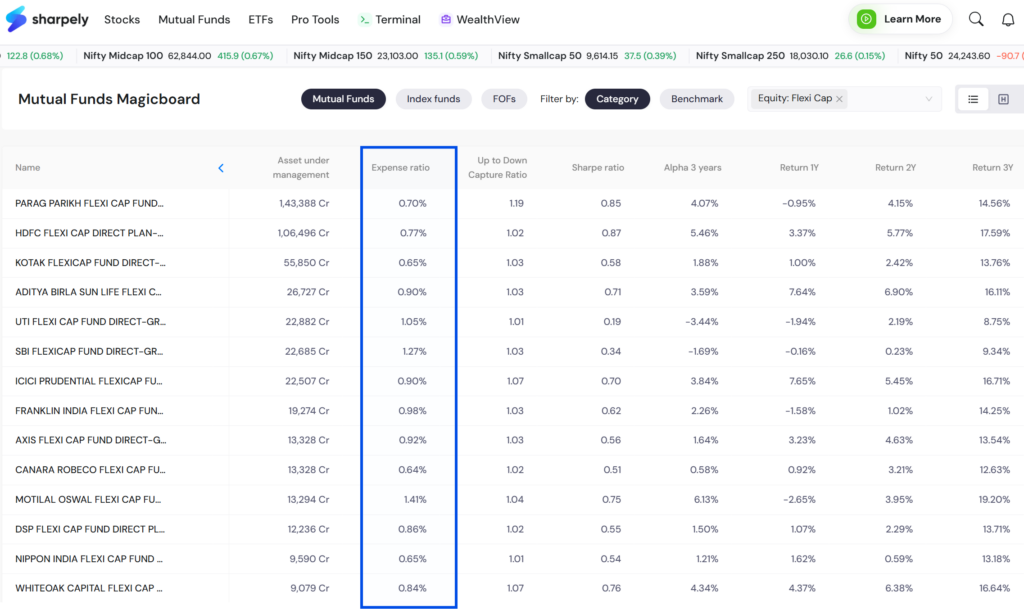
For index funds and ETFs: choose the lowest expense ratio among funds tracking the same index, all else being equal. The difference between a 0.05% and a 0.5% expense ratio compounds significantly over a 15–20 year investment horizon.
Metric 7: Portfolio Overlap with Your Existing Funds
The final metric is the one that operates at the portfolio level rather than the fund level, and it is the one most investors completely ignore. Portfolio overlap measures the percentage of common stock holdings between two or more funds in your portfolio.
What It Is
If your large-cap fund and your flexi-cap fund both hold significant positions in the same five or six companies, HDFC Bank, Reliance Industries, ICICI Bank, Infosys, TCS, a large portion of your combined equity exposure is effectively concentrated in those same names. You own two funds but you have not achieved two distinct risk exposures. You have one concentrated exposure wearing two fund names.
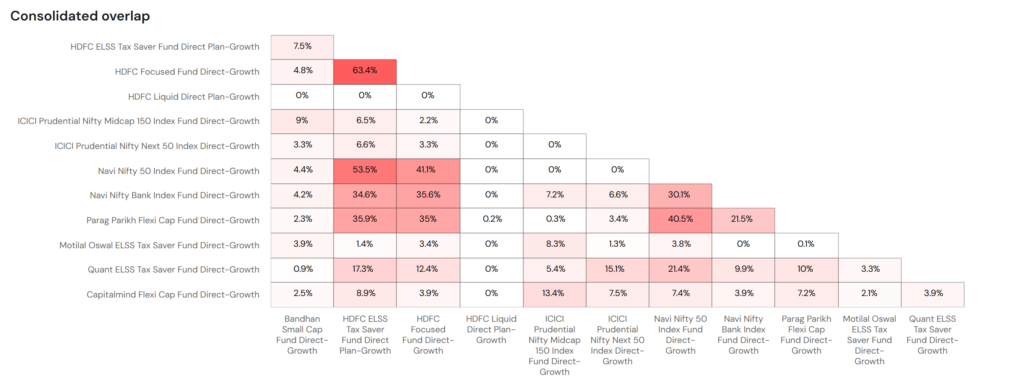
Industry data consistently shows that a Nifty 50 index fund and an active large-cap fund often have 70% or more overlap, because active large-cap funds are constrained by their mandate to invest primarily in large-cap stocks, which are the same stocks the Nifty 50 already owns. Holding both funds gives you the feeling of diversification without the substance of it, and you pay two expense ratios!
Why It Matters
High portfolio overlap has two direct consequences. First, it means your portfolio is less diversified than it appears, a single sector or company-level stress event can affect multiple of your funds simultaneously, not just one. Second, it means you are paying multiple expense ratios for what is largely the same underlying portfolio — an unnecessary cost with no diversification benefit to justify it.
This is what investors call diworsification, adding more funds to a portfolio while actually reducing genuine diversification. It is one of the most common and costly mistakes in mutual fund investing, and it is invisible unless you actively check overlap.
What to Look For
| Overlap Range | What It Means | What to Do |
| Below 30% | Healthy. Funds are doing genuinely different jobs. | No action needed. |
| 30% to 50% | Moderate. Some duplication exists. | Review whether both funds serve a distinct purpose in your portfolio. |
| Above 50% | High. Funds are largely investing in the same stocks. | Consider consolidating, you are paying twice for one exposure. |
Checking overlap requires comparing the full portfolio holdings of every fund you own, a task that is time-consuming to do manually using factsheet PDFs. sharpely’s WealthView does this automatically: connect your portfolio and it shows you the overlap between each pair of funds you hold, so you can see exactly where your portfolio is genuinely diversified and where it is not. You can also do this analysis for any fund in the MF Comparison Tool.
The 7 Metrics at a Glance
| Metric | What It Measures | What to Look For |
| Rolling Return Beat % | Consistency of outperformance vs category average | 70%+ over 3Y and 5Y rolling windows |
| Alpha | Return generated above benchmark-adjusted expectation | Positive and consistent over 3Y and 5Y |
| Sharpe Ratio | Return earned per unit of volatility | Higher than category peers; above 1.0 is good |
| Beta | Sensitivity to benchmark market movements | Know it and choose it intentionally |
| Standard Deviation | Volatility of returns over time | Lower than peers with equivalent or better returns |
| Expense Ratio | Annual cost of fund management | Lowest in category for passive; justified by alpha for active |
| Portfolio Overlap | Common holdings between your funds | Below 30% for genuine diversification |
What Good Mutual Fund Analysis Actually Looks Like
Running all seven of these metrics across every fund in your portfolio before investing, and periodically reviewing them after, is what separates a thoughtful investor from one who is simply guessing with extra steps.
The goal is not to find a perfect fund, no such thing exists. The goal is to understand what you own: whether the fund is earning its expense ratio through consistent outperformance, whether the risk you are taking is proportionate to the return you are receiving, and whether your overall portfolio is genuinely diversified or quietly concentrated in a handful of the same names.
Start with rolling return beat percentage to establish consistency. Add alpha to assess manager skill. Check Sharpe Ratio and standard deviation together to understand the risk-return trade-off. Verify the expense ratio is justified. And before adding any new fund, always check portfolio overlap against what you already own.
These seven metrics, reviewed together, give you a complete picture of a mutual fund that CAGR alone never can.