
A mutual fund screener is one of the most useful tools available to an individual investor, and one of the most commonly misused. Most investors either apply the same generic filters to every category regardless of whether they make sense, or they screen only on returns and call it research.
Neither approach works well. A mutual fund screener is only as good as the filters you apply, and knowing which filters actually matter, how to calibrate them correctly for different fund categories, and when to use relative thresholds instead of absolute ones is what separates a useful shortlist from a misleading one.
This article covers the filters that genuinely improve your fund selection process, the common mistakes investors make when applying them, and the single most important principle behind effective screener use: filters must be category-aware, not category-agnostic.
What a Mutual Fund Screener Actually Does
A mutual fund screener applies a set of quantitative conditions to the entire mutual fund universe and returns only the funds that meet every condition simultaneously. Instead of manually comparing dozens of funds one by one across multiple metrics, a screener collapses that work into seconds.
The output is a shortlist, not a buy list. Every fund in the screener result has cleared the conditions you set, but clearing a screener is the beginning of fund selection, not the end. It narrows the field. The actual decision still requires analyzing the fund in detail, understanding the portfolio composition, and assessing whether the fund fits the specific role you need it to play in your portfolio.
The filters you choose are the entire value of the screener. Apply the right ones correctly and you get a focused, high-quality shortlist. Apply the wrong ones, or the right ones to the wrong category, and you get a list that looks precise but is actually misleading.
The Most Important Principle: Filters Must Be Category-Aware
This is the most common, and most costly, mistake investors make when using a mutual fund screener: applying the same absolute filter thresholds across all fund categories regardless of whether those thresholds are appropriate.
Consider beta. A beta below 1.0 means the fund moves less than its benchmark, generally a sign of lower market sensitivity. For a large-cap fund, a beta below 1.0 is a reasonable filter. For a small-cap fund, it is almost meaningless. Small-cap funds by their nature have higher beta — the universe they invest in is more volatile than the large-cap universe. A small-cap fund with beta below 1.0 likely has significant large-cap exposure that is diluting the category exposure you actually wanted.
The same logic applies across multiple filters:
| Filter | Large Cap | Mid Cap | Small Cap | Why It Differs |
| Beta | < 1.0 is reasonable | < 1.1 to 1.2 is reasonable | < 1.3 may be acceptable | Small-cap universe is inherently more volatile than large-cap. |
| Standard Deviation | Lower is better within peers | Higher than large-cap is normal | Higher still is expected | Do not compare absolute std dev across categories — compare within category only. |
| Sharpe Ratio | Compare within large-cap peers | Compare within mid-cap peers | Compare within small-cap peers | Risk-free rate is constant; numerator and denominator both differ by category. |
| Rolling Return Beat % | 60%+ is good vs large-cap avg | 60%+ is good vs mid-cap avg | 60%+ is good vs small-cap avg | The category average benchmark changes — the threshold percentage does not. |
| Alpha | Positive vs Nifty 50 or large-cap index | Positive vs Nifty Midcap index | Positive vs Nifty Smallcap index | Alpha is always relative to the benchmark — benchmark differs by category. |
The rule is simple: always filter within a category, never across categories. Set your category filter first — large-cap, mid-cap, small-cap, flexi-cap, sectoral, etc. and then apply all other filters relative to that category’s universe. A filter that selects the best funds within a category is useful. A filter that applies a large-cap standard to small-cap funds is not.
Absolute Filters vs Relative Filters: Why Relative Wins
Most screeners offer absolute filters, you set a fixed threshold and the screener returns funds that meet it. Set expense ratio below 1%, get all funds with expense ratio below 1%. Set alpha above 2%, get all funds with alpha above 2%.
The problem with absolute filters is that they do not account for what is realistic within a given category at a given point in time. If the median expense ratio for active small-cap funds is 1.6%, an absolute filter of below 1% would eliminate almost every fund in the category, including genuinely good ones with reasonable fees. If alpha across the entire mid-cap category has been compressed due to a difficult market environment, an absolute filter of alpha above 5% might return no funds at all, not because there are no good mid-cap funds but because the threshold is inappropriate for the environment.
This is where relative or percentile-based filters are significantly more useful. Instead of saying ‘expense ratio below 1%’, a relative filter says ‘expense ratio in the bottom 50th percentile of this category’, meaning the fund’s fees are lower than at least half of its peers, regardless of what the absolute number is.
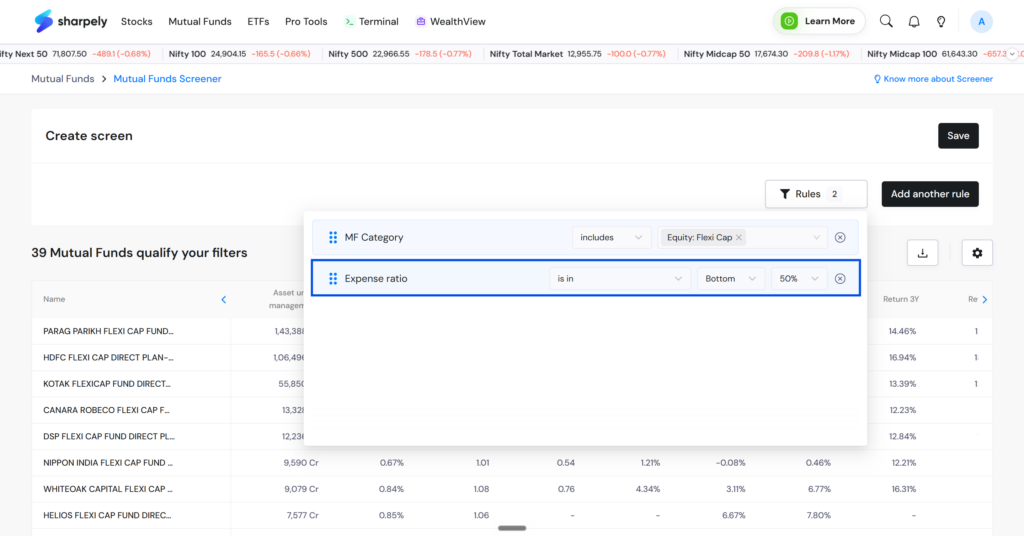
sharpely’s mutual fund screener allows exactly this. You can set filters like expense ratio in the bottom 50th percentile, alpha in the top 30th percentile, or Sharpe Ratio in the top 25th percentile, all relative to the category you are screening within. This approach is category-aware by design. It finds the best funds within a peer group rather than applying an arbitrary absolute threshold that may or may not be appropriate for that category.
Relative filters are particularly powerful for metrics like expense ratio, alpha, and Sharpe Ratio, where the absolute number varies significantly by category, market environment, and AUM size, but the relative ranking within a peer group is always meaningful.
The Filters That Actually Matter And How to Use Them
1. Fund Category
Always the first filter, before any quantitative condition. Select the specific category you are screening within: large-cap, mid-cap, small-cap, flexi-cap, multi-cap, ELSS, sectoral, thematic, hybrid, or debt. Every filter that follows is only meaningful within the context of a single, defined category.
Do not mix categories in a single screen and then compare the results as if they are equivalent. A flexi-cap fund with an alpha of 5% and a small-cap fund with an alpha of 5% are not equivalent, the benchmarks differ, the risk profiles differ, and the portfolio roles differ.
2. AUM (Assets Under Management)
AUM is a starting filter, not a quality filter. It tells you about fund size and liquidity — not about fund quality.
For large-cap and mid-cap funds, a minimum AUM filter (typically ₹500 crore to ₹1,000 crore) ensures sufficient liquidity and operational history. For small-cap and sectoral funds, very large AUM can itself be a risk, a small-cap fund managing ₹50,000 crore faces genuine difficulty deploying capital into the small-cap universe without moving prices against itself. Some of the best small-cap fund managers have closed their funds to new investors specifically because AUM had grown too large for the strategy to execute effectively.
Use AUM as a floor filter to eliminate very small, very new funds, and a ceiling consideration for small-cap funds where size can genuinely constrain returns.
3. Expense Ratio: Use a Relative Filter
The expense ratio is a guaranteed, compounding drag on your returns. Every basis point you pay in annual fees is a certain reduction in long-term corpus, regardless of market conditions.
Rather than setting an absolute threshold, set the expense ratio filter to the bottom 50th percentile within your category. This ensures you are looking at funds with below-average costs relative to their peers, without eliminating an entire category because its average fees happen to be higher than another category’s.
For index funds and ETFs tracking the same benchmark, the expense ratio is often the single most important filter, it is the primary source of return difference between two otherwise identical passive products.
4. Rolling Return Beat Percentage vs Category Average or Benchmark Average
This is the consistency filter, and the most important one for any SIP investor. It measures what percentage of rolling 1-year periods the fund outperformed its category average or benchmark average, not just whether it looks good from one fixed start date.
Set this filter to 60% or above for both (category and benchmark). A fund that consistently beats its category average across many different entry points is demonstrating repeatable outperformance, not a lucky run. A fund below 50% on rolling beat rate is underperforming its peers more often than it is outperforming them, regardless of what its headline CAGR says.
5. Alpha: Use a Relative Filter
Alpha measures the return generated above what the fund’s benchmark exposure would predict. For active funds, positive alpha is the justification for paying an expense ratio above what a passive index fund charges.
Rather than setting an absolute alpha threshold, filter for funds in the top 30th to 40th percentile of alpha within the category. This identifies funds whose managers are genuinely adding value relative to peers, and it does so in a way that adjusts for the market environment and category-specific alpha availability.
Remember: alpha is always measured against a specific benchmark. Nifty 50 or Nifty 100 for large-cap, Nifty Midcap 150 for mid-cap, Nifty Smallcap 250 for small-cap. A positive alpha reading in one category against one benchmark is not directly comparable to alpha in another category against a different benchmark.
6. Sharpe Ratio: Use a Relative Filter
The Sharpe Ratio measures return per unit of volatility. A higher Sharpe means more return for every unit of risk taken, a more efficient fund.
Filter for funds in the top 30th to 40th percentile of Sharpe Ratio within the category. As with alpha, using a relative filter is more robust than an absolute threshold because the level of achievable Sharpe varies significantly by category, market cycle, and risk-free rate environment.
The Sharpe Ratio is particularly useful for comparing funds within the same category that have similar returns but different volatility profiles. Between two mid-cap funds with similar 5-year CAGR, the one with the higher Sharpe Ratio delivered those returns more efficiently, with less volatility that investors had to absorb along the way.
7. Standard Deviation
Standard deviation measures the volatility of a fund’s returns over time. Use it as a within-category comparison, never across categories.
For investors with lower risk tolerance or shorter investment horizons, filtering for funds in the bottom 50th percentile of standard deviation within their category identifies options that deliver the category’s return profile with below-average volatility. For investors who can tolerate higher volatility and have a long horizon, this filter is less critical.
Standard deviation is the denominator in the Sharpe Ratio calculation, so if you are already filtering on Sharpe, standard deviation is partially captured. Use it as an additional filter when volatility management is a specific priority.
8. Up Capture Ratio and Down Capture Ratio
Up/down capture ratios are among the most informative, and most underused filters in a mutual fund screener. They directly answer a question that most other metrics cannot: how does this fund behave in up markets versus down markets?
The up capture ratio measures what percentage of the benchmark’s gains the fund captured during periods when the benchmark was rising. An up capture of 110 means the fund captured 110% of the benchmark’s upside, it went up more than the index during rising markets. An up capture of 85 means it captured only 85% of the upside.
The down capture ratio measures the same thing during falling markets. A down capture of 85 means the fund fell only 85% as much as the benchmark when markets were declining, it protected capital better on the way down. A down capture of 110 means it fell 10% more than the benchmark during declines.
The ideal combination is high up capture and low down capture, the fund participates more in market gains than it suffers in market falls. This asymmetry is one of the clearest signals of genuine active management quality.
A fund with an up capture of 105 and a down capture of 90, for example, is delivering an asymmetric return profile: it amplifies gains and dampens losses relative to the index. Over a full market cycle, which includes both bull and bear phases, this asymmetry compounds into significantly better risk-adjusted returns than a fund that simply tracks the index in both directions.
As with all other metrics, compare up/down capture ratios within the same category and against the same benchmark. A small-cap fund’s capture ratios are measured against the small-cap index, not the Nifty 50.
Screener Filters at a Glance
| Filter | Recommended Approach | Category Note |
| Fund Category | Set first, before all other filters | All other filters only make sense within a defined category |
| AUM | Minimum floor for liquidity; ceiling check for small-cap | Large AUM can constrain small-cap strategy execution |
| Expense Ratio | Bottom 50th percentile within category | Critical for index funds; important but not only factor for active |
| Rolling Return Beat % | Above 60% on for both category and benchmark | Always vs category average, not absolute index |
| Alpha | Top 30-40th percentile within category | Benchmark differs by category — never compare across categories |
| Sharpe Ratio | Top 25-40th percentile within category | Do not compare large-cap Sharpe to small-cap Sharpe |
| Standard Deviation | Bottom 50th percentile if volatility is a priority | Expected to be higher in small-cap — compare within peers only |
| Up Capture Ratio | Above 100 preferred; higher is better | Measured against category benchmark, not Nifty 50 for all |
| Down Capture Ratio | Below 100 preferred; lower is better | Best read alongside up capture as a pair — not in isolation |
Putting It Together: A Sample Screener Workflow
Here is how a systematic screener run looks in practice, using mid-cap funds as an example:
Step 1: Set category to flexi cap. All subsequent filters now apply only within this peer group.
Step 2: Set minimum AUM to ₹1,000 crore, eliminates very small or very new funds.
Step 3: Set expense ratio to bottom 50th percentile within flexi-cap, eliminates above-average cost funds.
Step 4: Set rolling return beat % above 60% for both category and benchmark, keeps only consistent outperformers.
Step 5: Set alpha to top 50th percentile within flexi-cap, confirms manager skill relative to peers.
Step 6: Set Sharpe Ratio to top 50th percentile within flexi-cap, confirms efficient risk-adjusted returns.
Step 7: Set up capture to down capture ration in top 50th percentile, filters for asymmetric return profile.
We have done the hard work and created this exact screen using our mutual fund screener. Here are the filtered names. Do note that this is not a recommendation.
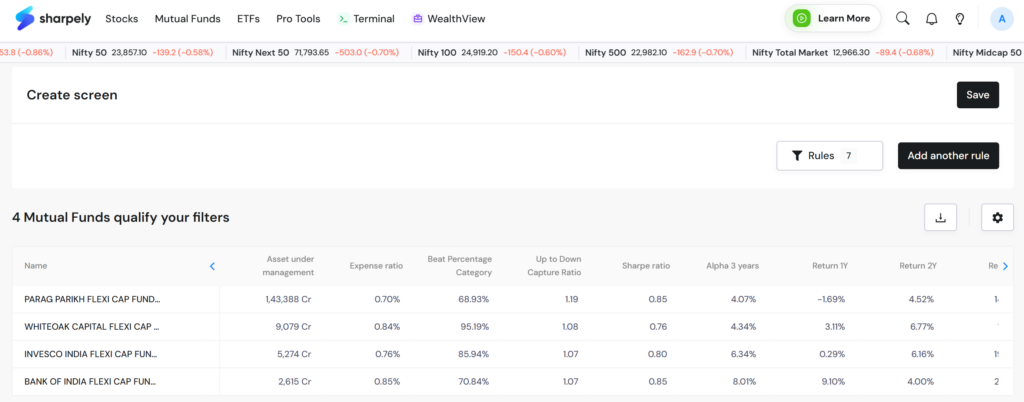
The result is a short, focused list of flexi-cap funds that are cost-efficient, consistently outperforming peers, adding alpha, managing risk well, and capturing more upside than downside across market cycles. That is a genuinely useful shortlist, not a long list of funds sorted by 3-year CAGR.
The Screener Is a Starting Point, Not a Final Answer
A well-configured mutual fund screener does the first round of work, it collapses a large universe of funds into a small, pre-qualified shortlist using objective, quantitative criteria. That saves significant time and removes the most obvious poor choices from consideration.
What it cannot do is replace the in depth analysis, understanding the fund’s portfolio composition and concentration, evaluating how the fund fits the specific role you need it to play in your portfolio, or checking whether adding it creates significant overlap with funds you already own.
Used correctly, with category-aware filters, relative percentile thresholds where appropriate, and a clear understanding of what each metric is and is not measuring, a mutual fund screener is one of the most efficient research tools available to an individual investor.
sharpely’s mutual fund screener supports relative percentile-based filters across all the metrics discussed in this article, within each fund category. If you want to screen within your chosen category rather than setting arbitrary absolute thresholds, that is where to run this framework.
Related reading
- Mutual Fund Analysis: 7 Metrics Every Investor Should Check
- Your Mutual Fund Portfolio Might Be Less Diversified Than You Think: Here's How to Check
- How to Analyze Mutual Funds for Better Returns: Key Metrics and Common Mistakes
- SEBI’s Mutual Fund Reforms: New Expense-Ratio Rules, Lower Fee Caps, and the Impact on AMCs